Innovative Research / Groundwork Collaborative
Gridlocked: How Public Power Can Build the Grid of the Future and Lower Bills Now
July 1, 2026
Overview
After decades of deregulation and complacency, the time is ripe to embark on a grand national project to fundamentally rethink how energy is generated and distributed in the U.S.
America’s energy system is at a crossroads. Since 2020, retail energy bills have risen nearly 40%, with no relief in sight.1 In 2025, utility companies requested a record $31 billion in rate increases from their customers and are on pace to exceed that with $93 billion in increases forecast over the next two years.2 Consumers have taken notice, with rising utility bills ranking at the top of affordability concerns.3 Two in three Americans say their electric bill has gone up in the past year, and nearly one in five American households is behind on their utility bills, with the average overdue balance rising to $789 over the past three years.4
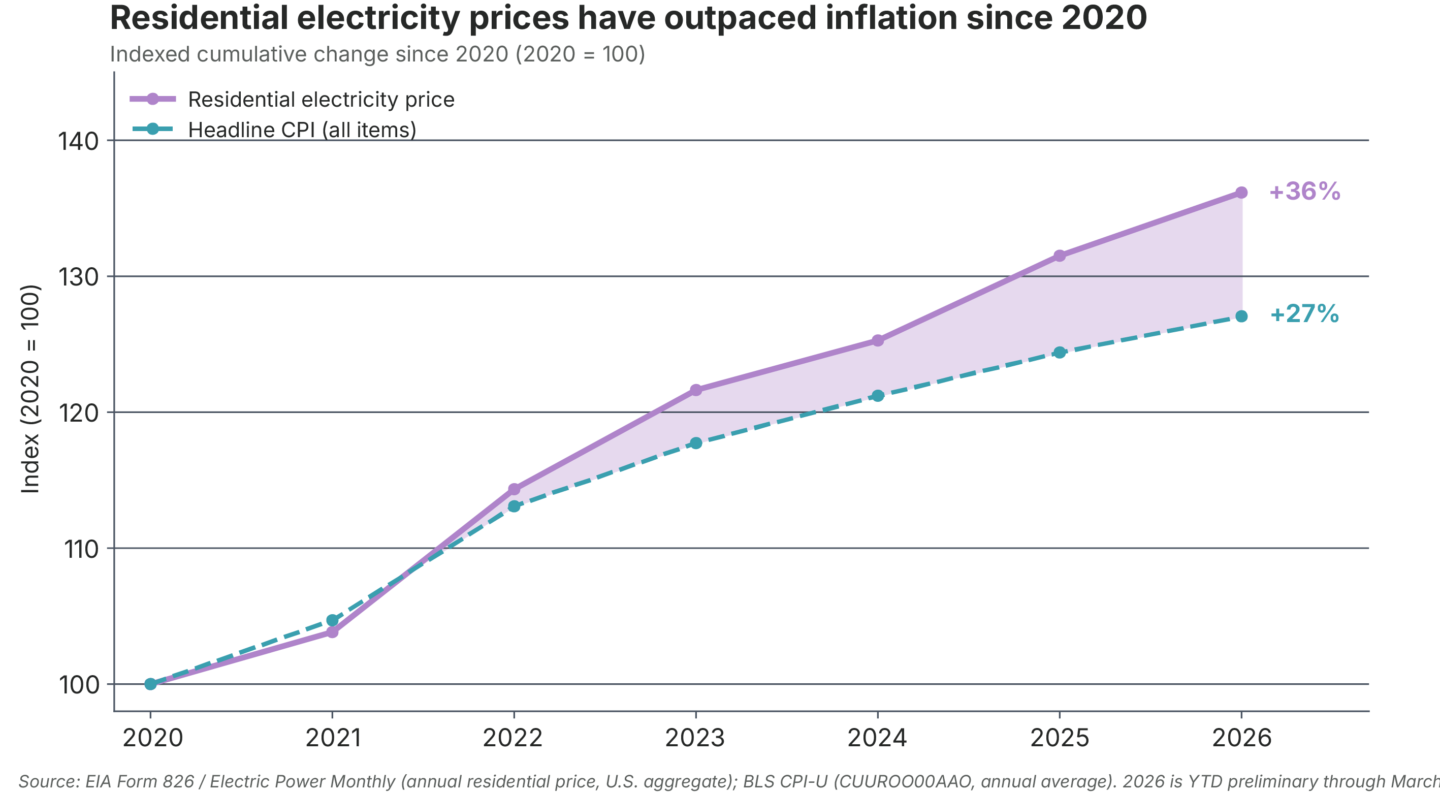
This is a stark reversal from recent trends. From 2000 to 2019, U.S. electricity demand was essentially flat, growing by less than 15% as efficiency gains offset growth. Retail prices followed a similar trajectory, largely tracking overall inflation.5 Now, as utilities scramble to build energy infrastructure to support massive data centers powering the artificial intelligence (AI) boom, American households are footing the bill. This new paradigm is pushing the existing system to the breaking point. Just last month, the CEO of PJM, the largest grid operator in the country, asked “whether the foundational assumptions of the market remain valid.”6
Today’s utility regulation model incentivizes inefficient building and rate hikes to feed profits. This model has siphoned profits to executives and investors while leaving families on the hook for a more costly and less reliable energy grid. Today, AI companies with seemingly endless investor funding seek to build as rapidly as possible, requiring enormous amounts of new energy infrastructure that utilities will recoup with painful rate increases.
After decades of deregulation and complacency, the time is ripe to embark on a grand national project to fundamentally rethink how energy is generated and distributed in the U.S.
At a time when public anger about rising bills and data center proliferation is reaching a fever pitch, debates about the future of the energy system are either too narrow to solve the problem or too rooted in the market fundamentalism that has eroded the capacity of the grid over decades. While the challenges of how to meet the demands of growing electricity demand are vast, the opportunity is just as great. After decades of deregulation and complacency, the time is ripe to embark on a grand national project to fundamentally rethink how energy is generated and distributed in the U.S.
Fortunately, this is not the first time the U.S. has faced the need to rapidly reshape its energy system in the face of powerful interest groups. During the New Deal, utilities were reorganized and firmly regulated while the Rural Electrification Administration electrified over 80% of rural America in under two decades.7 During World War II, the U.S. built nearly 3,000 miles of pipelines in little over a year.8 During the 1960s and 1970s, the Federal Power Commission directed the construction of the grid as we know it today.9 In each case, the federal government took bold action to plan, finance, and build the energy system.
The United States is at a similar crossroads today. Faced with rising costs and the largest increase in electricity demand in 50 years, policymakers cannot tinker around the edges of our existing grid or regulatory system. Nor can they ignore the immediate needs of households as Big Tech companies and investors reap massive profits on the backs of American families.
Instead, the federal government must pursue a bold vision of planning, financing, and building to lower bills for families, crack down on corporate profiteering, and build the clean, reliable grid of the 21st Century.
- Lower Bills Now. Policymakers should intervene directly to protect residential customers from rising utility bills by establishing price stabilization policies and targeted rate freezes that are contingent on the federal investment and planning needed to structurally bring prices down in the long term.
- The Future is Public Power. In the vein of the New Deal, we propose the creation of two new federal institutions — the National Power Authority and the Grid Trust Fund — to plan and finance interregional transmission and create the public backbone of the new electricity grid, while using existing practices and technologies to make the existing grid cheaper and more efficient.
- Making Data Centers Pay Their Fair Share. AI data centers must be forced to pay into the public purse to fully fund the buildout of new generation and transmission needed to meet their growing demand for electricity.
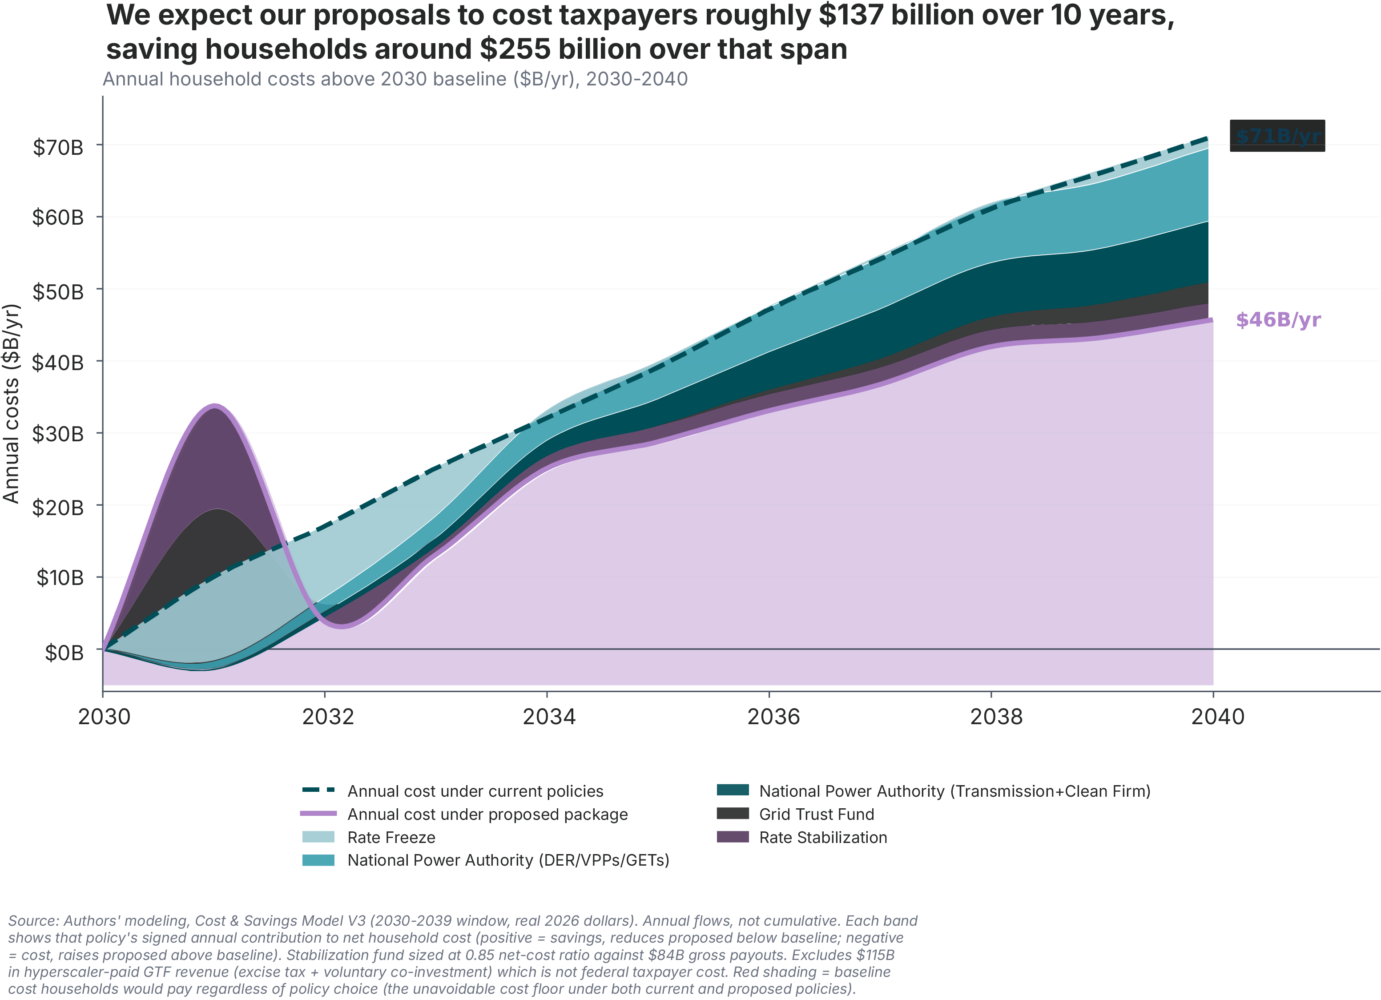
Taken together, we expect our proposals to cost taxpayers roughly $137 billion over 10 years, saving households around $255 billion over that span – roughly $1.90 saved for every $1 spent.
We have seen how clean energy policies fail to produce a durable political consensus when disconnected from the material needs of working families.10 We have also seen the potency of rising utility bills and unfettered data center growth as a political force that can oust those who ignore these needs. The twin conditions of the affordability crisis and rising energy demand present the opportunity to reimagine, revitalize, and restructure our energy system to serve both industry and residential customers in a smarter, fairer manner. Doing so will require strong and principled public sector intervention and a commitment to both protecting American households and building at a scale we have not attempted in decades. This is a blueprint for seizing that generational opportunity.
Gridlocked: How Public Power Can Build the Grid of the Future and Lower Bills Now
Taken together, we expect our proposals to cost taxpayers roughly $137 billion over 10 years, saving households around $255 billion over that span – roughly $1.90 saved for every $1 spent.
Read the full report.
The Old Model is Failing: Why Prices are Rising
To understand how the energy system can be reimagined, we must first understand the confluence of conditions that have led the system to this breaking point. These include the broken investor-owned utility business model, the flaws of market-based deregulation, our aging grid, and unprecedented load growth.
Investor-owned utilities (IOUs) are regulated monopolies whose revenues are tied directly to their capital expenditures, meaning they earn a guaranteed rate of return on every dollar invested in physical infrastructure. This creates a well-documented incentive to overbuild, overpay, and resist planning reforms that would reduce capital deployment.11
As a result, the dominant response to the IOU model has been to challenge incumbent utilities by introducing competition into wholesale markets, retail markets, and capital allocation. However, without changing the underlying incentive structure, calls to reform utility regulation via the market consistently underperform because competition is fundamentally misaligned with the defining characteristics of the electric utility as a natural monopoly: network economies of scale, substantial coordination needs, long planning horizons, and returns that accrue slowly.
For example, beginning in the late 1990s, roughly half the United States restructured its wholesale electricity markets, opening supply to competitive providers.12 States such as New York and Texas similarly introduced competition at the retail level through customer choice programs. Twenty years later, a peer-reviewed assessment of both wholesale restructuring and retail choice found the results mixed at best.13
A landmark 2025 study from Lawrence Berkeley National Laboratory (LBNL) and its subsequent 2026 update sought to catalog the trends in retail electricity bill growth and found stark disparities across states and regions. While no two markets are the same, we can see what has driven recent cost increases, what is likely to drive future cost increases, and dispel myths about retail bills.
Without changing the underlying incentive structure, calls to reform utility regulation via the market consistently underperform.
Since 2019, a few primary drivers account for most price increases. They all come down to fundamental choices about how we build the grid and who pays for it. The first and most visible is the transmission and distribution infrastructure that moves electricity across regions and to households. The high-voltage transmission grid has been underinvested in for decades, and most of the capital investment that has been made was to replace aging infrastructure, not building additional capacity to harness new generation. As a result, one-third of U.S. transmission infrastructure is operating near or beyond its useful life.14
Almost no new transmission has been built between regions that could transmit power from different generation sources across the country. Whether and how transmission is built will therefore have huge implications for utility bills nationwide: the Department of Energy’s 2024 National Transmission Planning Study found that every dollar invested in interregional transmission between now and 2050 will save $1.60 to $1.80 in total system costs.15
These investments do not only need to be made in new transmission lines. Rebuilding existing lines can improve capacity by as much as 12 times or more, and improvements such as advanced reconductoring can be made to existing lines to boost capacity. A study from Idaho National Laboratory found that roughly 20% of the United States’ existing transmission lines are candidates for advanced reconductoring.16
Distribution – the last mile that delivers power to homes and businesses – is a similar story. These capital investments are disproportionately assigned to residential customers, generating substantial returns to shareholders while being financed directly by utility customers. Similar to transmission, nearly half of U.S. distribution infrastructure is operating near or beyond its useful lifetime.17
A growing share of transmission and distribution spending, particularly for climate-affected regions, is replacement and hardening of grid assets after storms and wildfires. Surcharges in places that have been hit hard by climate-accelerated natural disasters like New York, Maine, Florida, and California can add hundreds of dollars per year to residential bills.18 These costs for residential customers — who are paying for the climate risks of corporations that have fought against climate policy for decades — will only increase as climate change accelerates and exacerbates extreme weather.
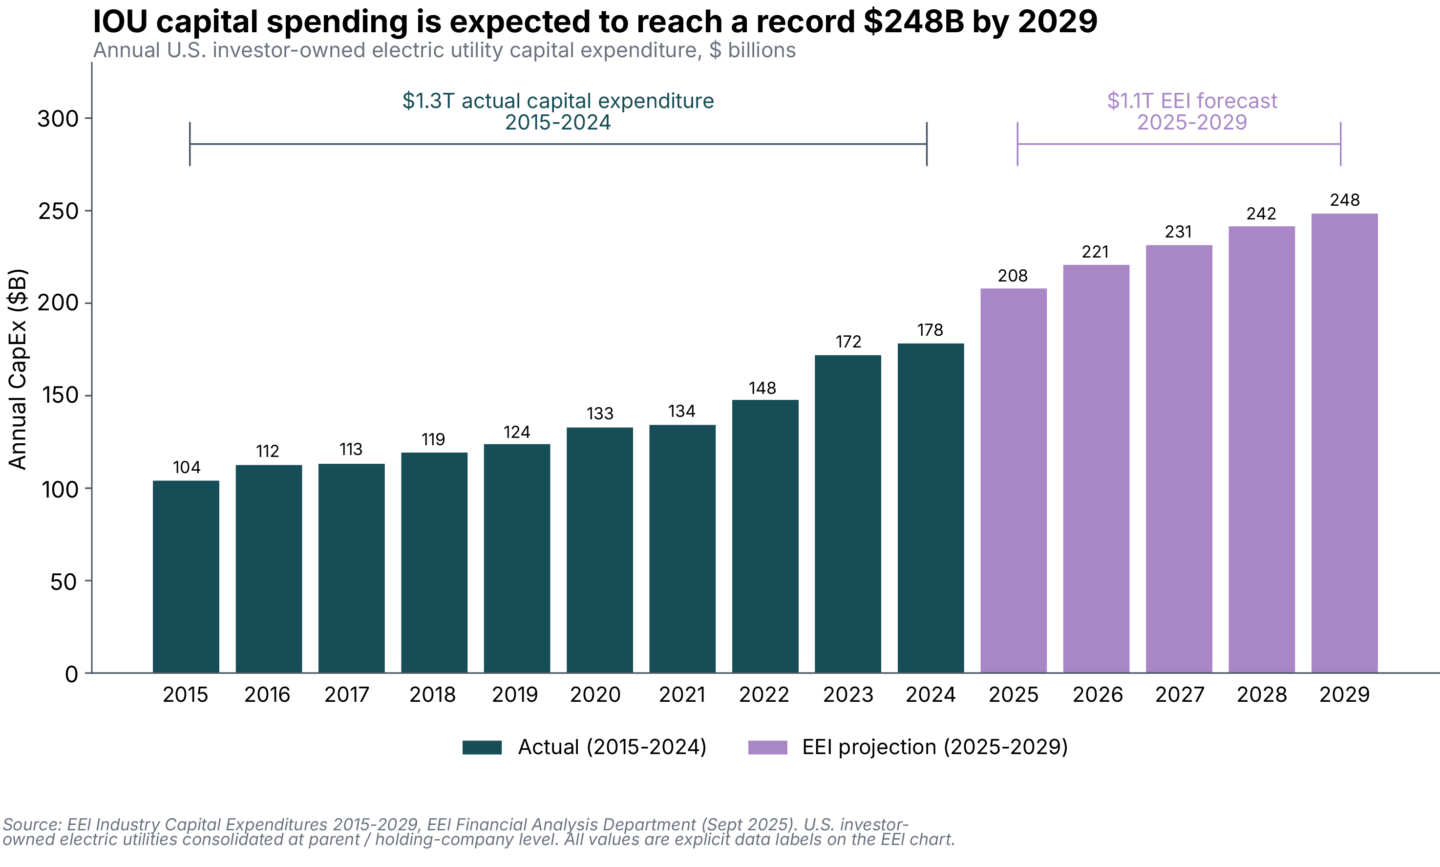
Capacity growth — the build-out of electricity generation like natural gas power plants, solar farms, and wind turbines — is increasingly driving up prices after roughly a decade of flat investment. IOUs increased generation budgets by 25% in 2025 on top of 16% to 17% increases in both 2023 and 2024.19 Like transmission and distribution, these feed directly into the rate base. The combined asset base grew by $430 billion between 2019 and 2024, and the industry projects that IOUs will spend more than $1.1 trillion on grid infrastructure in the next five years, with more than $200 billion in 2025.20 Capacity growth is not strictly tied to load growth; when supply is adequate, load growth can push down bills, as the costs are spread over a larger pool of customers. However, due to supply chain constraints, permitting challenges, and interconnection bottlenecks, the pace of new generation capacity is unlikely to match the pace of load growth from customers like data centers, leading to supply shortages and higher costs in the near term.21
LBNL also reveals how generation sources impact retail prices, from natural gas to wind to behind-the-meter solar.
First, contrary to popular myths, regions exposed more heavily to natural gas have seen price increases and volatility. While stable, cheap natural gas prices pushed bills down in the mid-2010s, spikes related to Russia’s war in Ukraine and other geopolitical events were the primary drivers of price increases in 21 states in 2025. Gas has also been shown to be increasingly unreliable in a time of mounting climate volatility. Extreme cold weather events have resulted in unexpected production declines in recent years, particularly in Appalachia, Texas, Oklahoma, and Louisiana.22
Second, contrary to the political narrative generated by the right, climate and clean energy policies are neither the main nor even a significant cause of rising electricity prices. Solar and wind are currently both cheaper and faster to deploy on a per-megawatt (MW) basis than their lowest-cost fossil fuel alternatives, placing downward pressure on retail electricity prices.23 However, states with Renewable Portfolio Standards have largely mandated the cheap part of the transition while failing to plan or pay for the costlier parts that make it reliable and affordable, such as grid planning and coordination. Even so, states with unfunded Renewable Portfolio Standards have seen about $40 added to annual bills.24
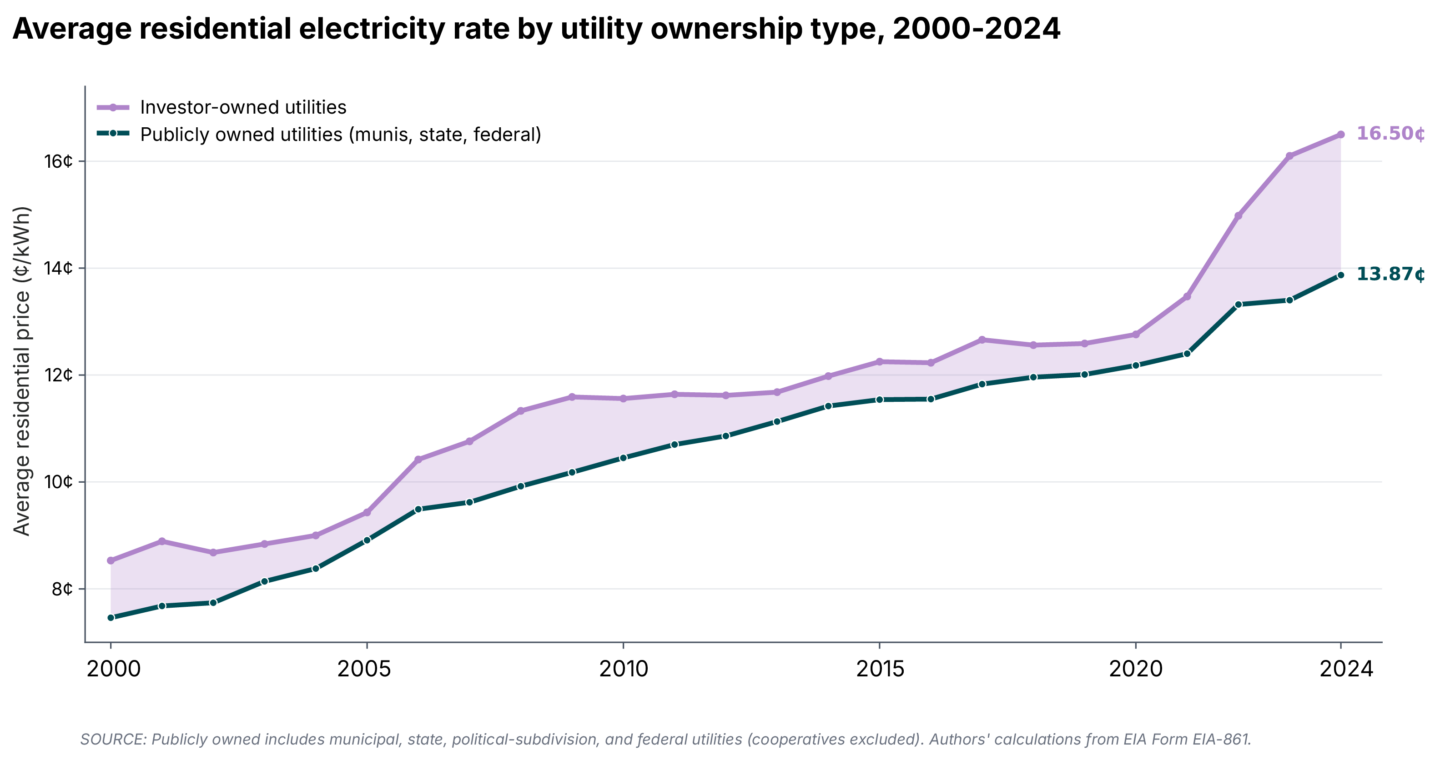
These cost drivers all tie into one cross-cutting fact: the costs of financing the grid, whether to replace old infrastructure, meet new demand, or recover damages from extreme weather and related disasters, are borne directly by utility customers in a system that rewards utilities, their investors, and large corporate energy buyers for adding to the rate base. While Public Utility Commissions exist to serve as a watchdog for inflated spending and egregious rate increases, regulatory capture and complacency have led many of them to become rubber stamps for inefficient investment and runaway rate hikes. This is further illustrated by the growing gap the LBNL study finds between IOU prices and the prices charged by publicly and cooperatively owned utilities.
The question is not whether we must invest in the grid… The question is who pays and how we plan for it.
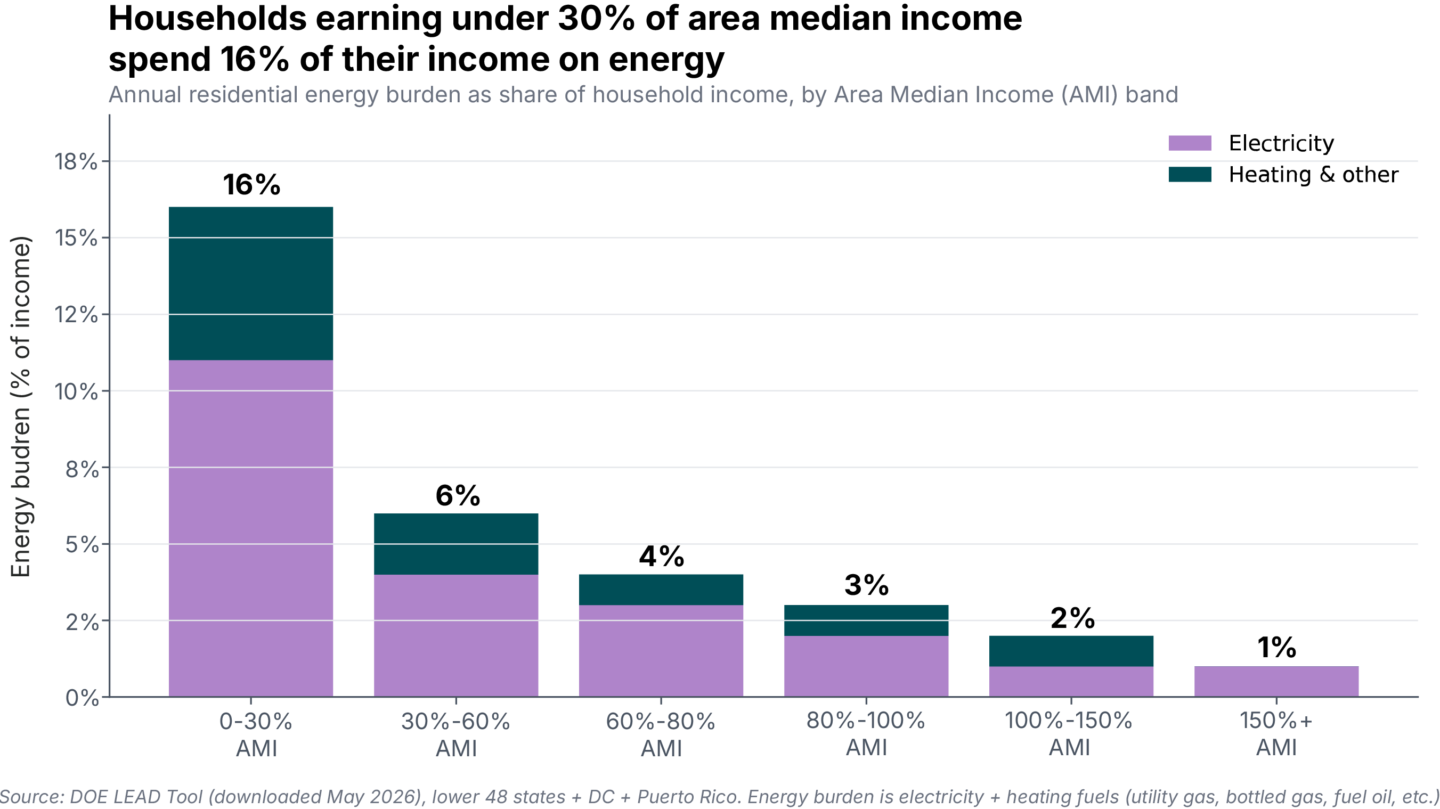
The regressive nature of our existing rate-based system compounds these rate increases. Because retail energy bills are generally charged at a volumetric per-usage rate, the burden of rising costs falls hardest on those least able to bear it: low-income households that often live in older and less energy-efficient housing.25 As a result, low-income households spend 8.6% of their income on energy costs, more than triple what higher-income households pay.26 And, while lower electricity rates for industry have long been a tool for attracting companies that offer long-term jobs at good wages, this informal social compact is now being used to subsidize large corporations and data centers that offer few jobs and questionable tax revenue.
The question is not whether we must invest in the grid. Electricity demand is now projected to grow between 103 gigawatts (GW) and 197 GW by 2030 – the equivalent power of 10 to 20 New York Cities.27 The question is who pays and how we plan for it.
The Case For Planning and Bold Public Investment
A national electric grid that delivers affordable power to households and industry will require federal planning and investment. Some constituencies, including those currently on the receiving end of federal hostility, may balk at the notion of federal intervention. But the grid — as a shared national network not unlike the Interstate Highway System — requires the federal government to act as a collective, coordinating actor. The case laid out below is not for the nationalization of incumbent utilities nor the federal takeover of state regulators; it is to plan, finance, and build the public backbone on which state and private actors rely.
"Government is simply the name we give to the things we choose to do together."
Rep. Barney Frank
The American electricity system was built through successive phases of planning and state coordination, each triggered by crises that private actors could not coordinate and resolve on their own. In each case, public planning, regulation, and investment proved decisive. The early days of electricity, marked by the 1882 opening of the Pearl Street Station in Lower Manhattan by Thomas Edison, were characterized by municipal ownership of small local utilities as cities and towns electrified, chaotic competition between emerging private firms, and eventual consolidation into powerful monopoly holding companies.28 This era, which came to be defined by widespread market abuse, culminated in the Public Utility Holding Company Act of 1935, which forcibly restructured and regulated the utility industry following the bankruptcy of the largest conglomerates.29
The New Deal era then produced a suite of public power institutions and regulators, most of which still exist today. This includes the Federal Power Commission (FPC, which later became the Federal Energy Regulatory Commission, or FERC), the Tennessee Valley Authority (TVA), the Rural Electrification Administration (REA), the Bonneville Power Administration (BPA), and the other Power Marketing Administrations (PMAs). Together, these new public institutions regulated the new class of private utilities, drove cheap public capital to regions of the country that private investment would not touch, built massive hydropower infrastructure projects, and electrified rural America over 15 years.30 In each case, public institutions and balance sheets responded to market failures that prevented the private sector from otherwise self-regulating, coordinating, or financing energy infrastructure.
The transmission grid as we know it today was largely coordinated by the federal government in the 1960s and 1970s. During the ‘60s, rampant postwar economic expansion and electrification drove significant load growth, with the FPC chartering construction across the country – a planning role with no contemporary analog today.31 But, as the 1970s and 1980s moved toward deregulation and privatization of national institutions like railways and airlines, electric utilities were soon to follow. The 1990s and 2000s saw a bipartisan push for deregulation of wholesale electricity markets and the introduction of retail choice, as free-market conservatives sought lower costs through competition and environmentalists backed deregulation on the theory that competitive markets would favor cleaner sources over incumbent coal utilities.32
This resulted in the dismantling of much of the federal planning architecture that had governed grid development for decades. However, the gains have failed to materialize. Deregulation produced mixed results on affordability. Deregulated states have energy bills that are 6% higher, and the early deregulation years are infamously associated with events like the 2000 to 2002 California energy crisis, wherein Enron manipulated the market to drive prices higher, resulting in widespread outages and enormous electricity bills.33
Reembracing Public Power
To adequately meet the demands of today, we must learn from our storied history and embrace public planning and financing to build a 21st century energy grid that can deliver lower prices for consumers and plentiful infrastructure to absorb new growth.
Today, transmission serves as a bottleneck for our grid, but it should be the backbone: an electric commons that enables load growth to lower prices by spreading costs, rather than a balkanized system governed by private interests that limits capacity growth and generates uneven costs.
There is no shortage of capital to solve this problem when AI companies are poised to invest $1.7 trillion in data centers by 2030, a substantial share of which will go to power.34 However, the United States currently has no institution with the mandate, authority, and financing capacity to plan and coordinate this investment across a national system.
Today, transmission serves as a bottleneck for our grid... but it should be the backbone.
The grid must approximately double to triple its 2020 capacity by 2050.35 Given the energy geography of the United States, interregional transmission will inevitably act as the aorta for this new system, bringing low-cost wind power from the plains and solar energy from the Southwest to markets across the country. Policymakers can take inspiration from New Deal public power programs as well as contemporary examples offered by states like Texas, where publicly planned transmission projects have unlocked vibrant markets for private capital, reducing retail costs while enabling the speed-to-power and regulatory certainty that is attractive to renewable energy investment and new grid customers alike.
Proponents of the existing system have argued that the high rate of return enjoyed by IOUs is necessary to attract private investment in the grid. We would be better off asking whether this market is suited for private investment and ratepayer financing in the first place, particularly given that transmission and distribution are natural monopolies and essential infrastructure with the benefit of non-bypassable charges that everyone must pay. As a result, transmission almost never defaults and has virtually no credit risk outside of wildfire and natural disaster concerns.
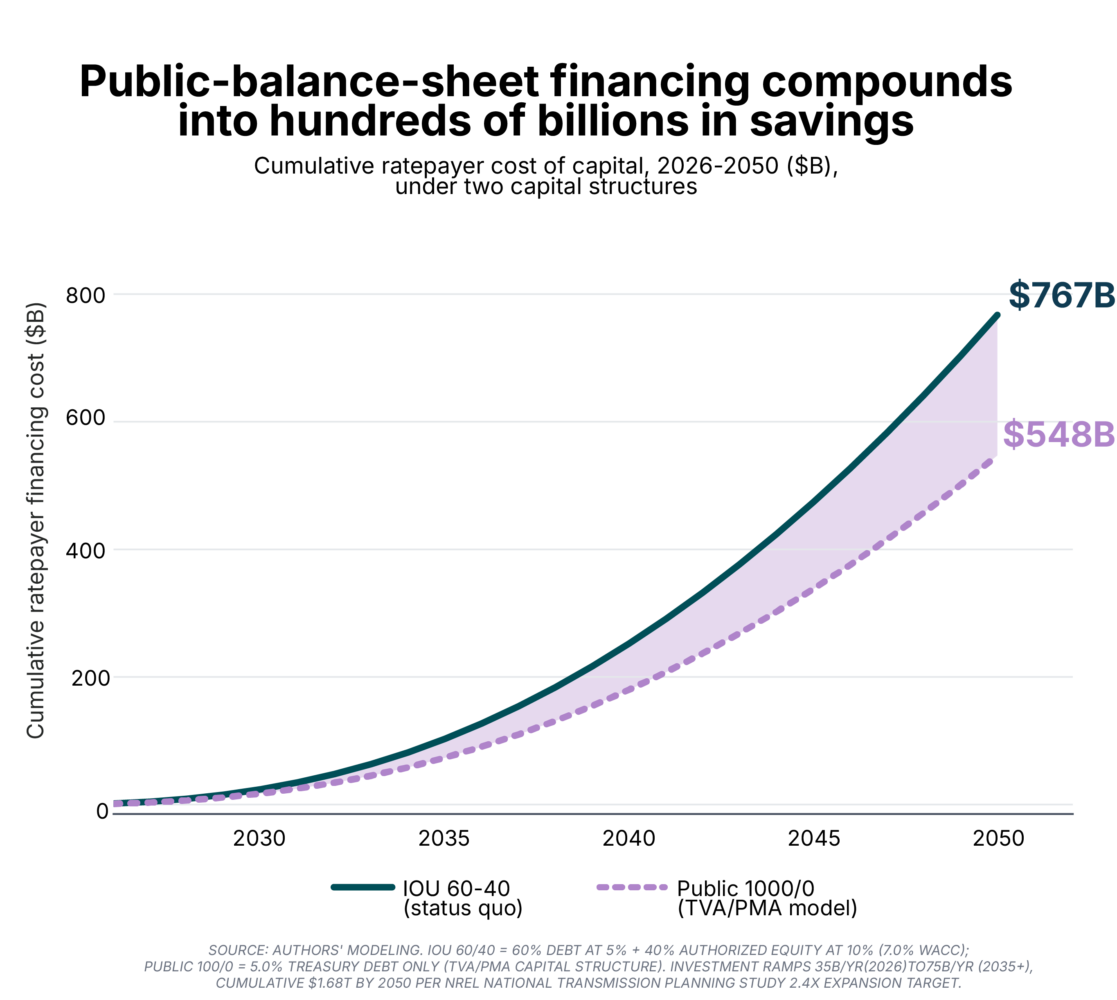
Public balance sheets can offer public financing that is cheaper than IOU equity by a substantial margin. Where IOUs currently deliver shareholders an authorized return of about 10% with a weighted average cost of capital around 7%, Treasury yields currently sit around 5%.36 The DOE National Transmission Planning Study finds that the U.S. transmission system must expand 2.4 to 3.5 times its current size by 2050, compared to current IOU transmission spending of roughly $35 billion annually.37 At the scale of investment the grid requires, that differential compounds into hundreds of billions of dollars that utility customers would otherwise transfer to shareholders, rather than into infrastructure.38 And, unlike calls to reduce utility return-on-equity (ROE) through competitive bidding processes, public financing would sidestep the debate over whether high returns are necessary to attract private capital investment.
Cost of capital is only half the story, since public financing would also enable higher leverage. Equity demands higher returns than debt because equity holders bear residual risk. IOUs typically operate at roughly 60/40 debt-to-equity, a conservative ratio by infrastructure standards. For comparison, other long-duration assets like toll roads, airports, and pipelines routinely finance at 70/30 or 80/20 debt-to-equity.39 The existing IOU ratemaking framework makes it so that debt-equity mix and ROE are interdependent, since regulators respond to higher leverage by allowing higher returns. However, the federal balance sheet would enable higher implied leverage of up to 100/0 debt-to-equity, similar to the TVA/PMA model where there is no equity tranche at all.40 Since the cost of capital flows through to customer bills, a financing structure with less (or no) equity and cheap public debt means lower bills for households.
The Political Window is Now
Like the crises and load growth that drove previous grid expansion, record bills, data center investment, geopolitical conflict, and supply chain crises have created a rare alignment of constituencies that does not exist in normal regulatory moments. As a result, the political terrain is ripe for new coalitions to form and reorient the grid toward public planning and investment: residential utility customers facing record bills; AI companies and utility investors that need regulatory certainty and scale; workers with a generational stake in a sustained buildout; climate advocates looking to electrify our energy system; strategic, electricity-intensive industries such as steel, aluminum, and semiconductors; and red-state economies sitting on the wind and geothermal resources the transition requires.
The political terrain is ripe for new coalitions to form.
The public wants the federal government, in particular, to play a role in fixing the grid. While polling from Groundwork Collaborative has shown that 60% of voters want the public sector to lead on grid modernization, polling from PowerLines shows that only 29% of Americans think that state governments do a good job protecting consumer interests on utilities, down from 38% the previous year.41 This indicates that the public does not trust state Public Utility Commissions alone to solve this crisis.
Rapid data center proliferation, in particular, adds urgency. Absent a public institution setting the terms, data center capital will arrive on industry terms, with cost allocation settled through regulatory proceedings in which Big Tech, IOUs, and independent power producers hold overwhelming advantage over the public. Absent a public institution planning the grid, AI companies, utility investors, and other industries may also not receive the regulatory certainty, reliability, and speed-to-power needed to meet their investment horizons.
As affordability rightfully dominates Democratic messaging, the political lesson of the Inflation Reduction Act (IRA) should teach us that a broad, working-class coalition is available only if an agenda for bold public investment and planning also delivers immediate relief at the kitchen table.
An Affordable Energy for All Agenda
Given the span of challenges described, policymakers must look to employ a bold, whole-of-supply-chain approach to grid governance, including demand-side interventions that ensure immediate affordability and supply-side planning that enables rapid and efficient load growth to maximize public benefit.
Lower Bills Now
Due in part to growing data center demand and the war in Iran, utility bills are now a kitchen table issue that cuts across party lines. As a result, any industrial agenda that does not lead with bill relief is at risk of being politically outflanked. Rather than seeing demand-side interventions as a concession to populism or a distraction from necessary reforms, policymakers should see them as tools that create the political conditions under which bold structural reforms become possible.
Price regulation, in particular, can play a critical role in limiting inflationary pressures while insulating vulnerable constituencies from temporary price shocks.42 In the realm of electricity, policymakers should consider both a rate freeze in the short-term and policies to stabilize rates over the medium-term.
One criticism of price controls is that they mask the price signal, inducing demand and leading to imbalances.43 However, the inverse argument for exposing residential utility customers to the market ignores the fact that households relying on electricity for their basic needs have limited agency to curtail usage when prices rise.44 As a result, nonlinear pricing schemes can protect basic consumption while preserving savings incentives in a supply crisis. Smartly designed rate regulation, as a temporary measure paired with meaningful supply-side reform, can then allow the grid to “catch up” to new load demands while insulating residential customers from volatility as we shift significant infrastructure costs to Big Tech and the public balance sheet.
Price Stabilization: A Ratepayer Stabilization Fund
Lawmakers should consider price stabilization policies in which households have the option to opt in to a fixed, per-kilowatt-hour (kWh) rate for both supply and delivery charges, ensuring a predictable energy bill each month. Stabilized rates would insulate residential and commercial utility customers from volatility created by gas prices, load growth, or natural disasters in recent years. Under the proposed scheme, utility customers would have the option to opt in to a fixed rate each year on a subscription basis.
Price regulation…can play a critical role in limiting inflationary pressures.
Norway provides the most instructive international model of this scheme. In December 2021, Norway introduced Strømstøtte, a dynamic subsidy that reimbursed households for a portion of electricity costs when spot prices exceeded a threshold.45 In October 2025, Norway introduced Norgespris (“Norway Price”), a fixed-price opt-in program offering residential customers a stable rate of 0.40 NOK/kWh with a monthly cap of 4,000 kWh.46 Uptake was substantial. Analysts at Thema and SØA have noted demand-induction concerns, which argue for pairing any stabilization program with a nonlinear consumption cap for stabilized rates and customer class limitations.47
Not unlike the Strategic Petroleum Reserve, price stabilization in the U.S. would rely on a two-way fund that is exposed when spot prices exceed the fixed rate, narrows to near-zero exposure in normal times, and would replenish reserves in scenarios where prices fall. This fund would be seeded through federal appropriations and have access to Treasury backstop borrowing authority in case of unexpected price spikes. The fixed rate would be set according to market conditions, either as the average retail rate over the previous year or as a rolling, CPI-adjusted average of previous years’ rates.
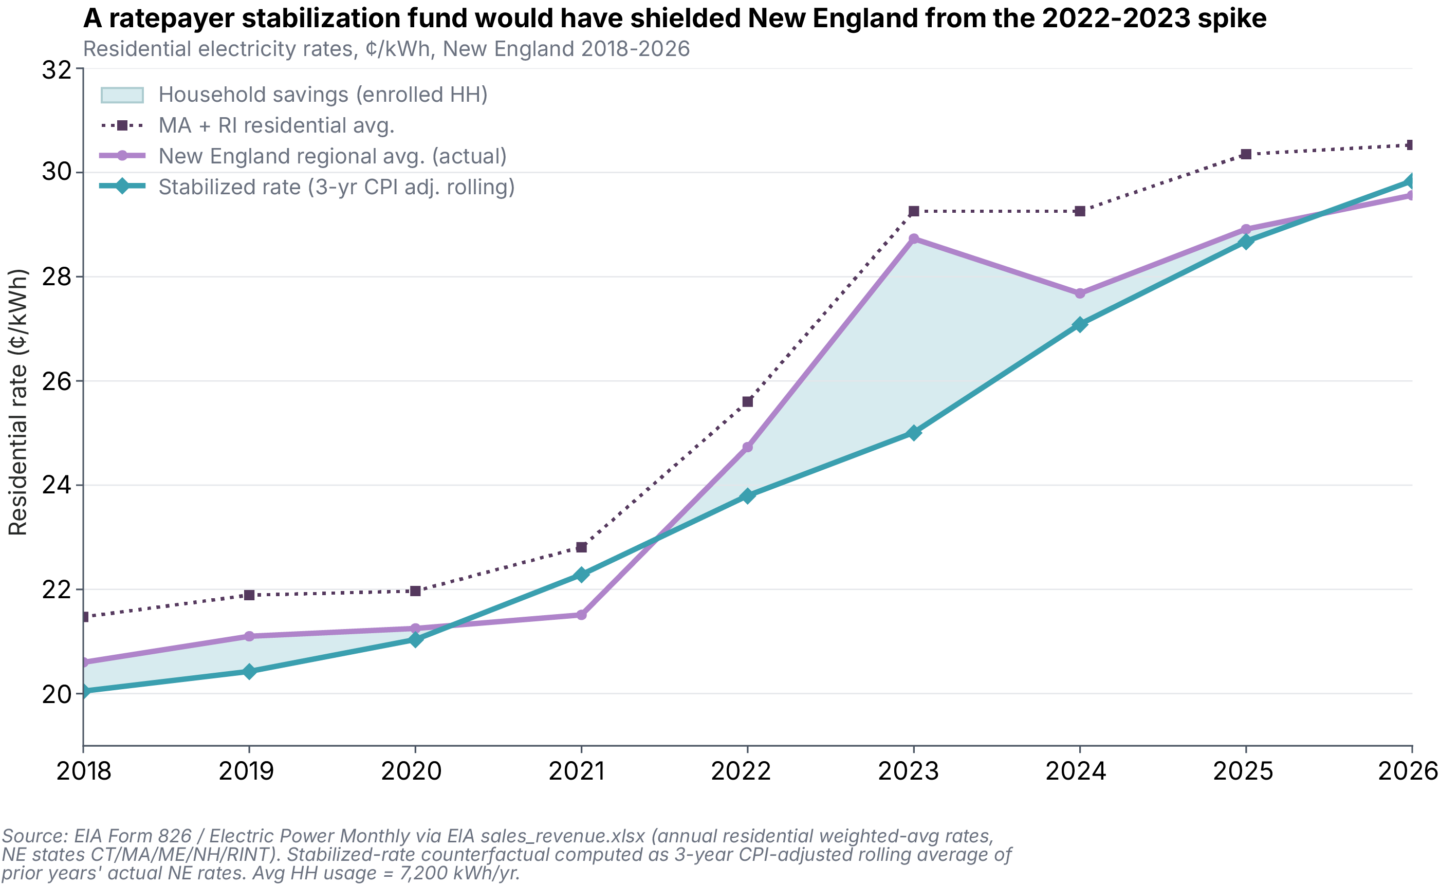
New England, which sits at the end of constrained gas pipelines and depends on imported liquefied natural gas (LNG) from the global spot market, has been highly subject to commodity-driven price volatility and provides an instructive hypothetical of how this stabilization fund could work.48 When Russia invaded Ukraine in February 2022 and drove up global LNG prices, Massachusetts’ National Grid supply rate rose 64% to 33.9¢/kWh by November 2022. New England’s regional residential average reached nearly 29¢/kWh in 2023 — a 34% increase from pre-war levels.49 As subsequent mild winters eased LNG competition, retail rates fell back to an average of 27.68¢/kWh in 2024.50
A stabilization fund would be designed to address price spikes like these. Assuming the fixed rate under this scheme is set as a three-year rolling average of previous years’ rates, adjusted for inflation, New England households would have paid a rate of approximately 25¢/kWh in 2023.51 Against the peak of 2023, enrolled households in Massachusetts and Rhode Island – where rates approached ~33-34¢/kWh – would have saved approximately $600 per year.52 At 25% enrollment across New England, the fund would have paid out approximately $535 million between 2022 and today, with payouts peaking at $358 million in the peak crisis year of 2023.53 As the higher rates of 2022 and 2023 entered the three-year rolling average, the freeze rate would have gradually risen to 28.7¢/kWh in 2025, converging toward the prevailing market rate.54 In 2026, the fund’s payouts would turn negative, meaning that the fund would begin to replenish reserves.55
Freeze Rates Now
Rate freezes, or price caps, are a similar demand-side intervention that policymakers should consider for residential and small business customers in order to establish the political conditions necessary for a large industrial transition. However, unlike stabilization, a rate freeze fund would have higher exposure and must be conditioned on building sufficient capacity in order to prevent a price spike when the freeze expires. This paper therefore proposes framing a rate freeze as a voluntary compact between a utility and the government — where the freeze is explicitly contingent on accepting federal investment and structural reform — rather than a mandate.
Rate freeze participation would be conditioned on utility commitments to transmission planning and capacity procurement. Utilities would be required to apply and receive a Title XVII §1706 loan guarantee, and utilities participating in the rate freeze would commit to redirecting a portion of their shareholder dividends to capitalize the rate freeze fund. This would require shareholders to absorb some of the costs of the freeze, instead of taxpayers. In exchange, utilities would receive a federal backstop through the §1706 program, as well as priority access to a slew of federal benefits including grid equipment via the Defense Production Act, expedited interconnection queue placement for new capacity, federal leaseback programs to ease credit risks, and transmission co-investment. Over medium-term time horizons, our model shows the benefits of these incentives would outweigh the costs of a brief, multi-year freeze.
Georgia and New Jersey provide the most instructive domestic examples. Georgia — a state with one of the country’s largest data center booms — established a three-year residential rate freeze in 2025, pairing the freeze with a large-load tariff that will ensure data centers pay for necessary transmission and distribution upgrades.56 In New Jersey, average retail prices rose more than one-third between June 2023 and June 2025, driven primarily by new data center demand. This led New Jersey Gov. Mikie Sherrill to direct the Board of Public Utilities to freeze residential rate increases and study potential utility reform, including performance-based ratemaking and ROE reductions.57 Whereas state-level actions like Georgia’s and New Jersey’s are limited by capped budgets and limited industrial incentives, a federal rate freeze would have more tools on the table.
A run of the numbers indicates that such a proposal is not far-fetched. National average residential rates rose from 16.48¢/kWh in 2024 to 17.47¢/kWh in 2025 — a 6% increase.58 If we make the conservative assumption that only utilities facing the largest rate increases and strongest regulatory pressure are those that would enroll — primarily deregulated utilities in PJM, New England, California, and New York — then we can estimate that approximately 28 million households would be subject to the rate freeze.59 At an extrapolated rate increase of ~6% per year in these regions, households would save roughly $650 over a three-year freeze period, with some households in PJM saving $1,000 or more.60 The gap in frozen rates and market rates would be closed through the combination of a §1706 loan guarantee, which would enable utilities in these territories to capitalize more cheaply, and limited deferred recovery. Federal fiscal exposure would thus be limited to the credit-subsidy cost of the §1706 loan guarantee, rather than the headline cost of principal.
In addition to other federal incentives, the Title XVII §1706 loan guarantee would ensure that participating utilities have both the investment and incentive to procure necessary capacity, preserve their credit health, and avoid a fiscal cliff when the rate freeze expires. In a scenario where PJM, New England, California, and New York participate in the freeze, we estimate these regions will account for 29% of national demand growth, driven disproportionately by data center concentration.61 In these regions, an estimated 30 GW to 60 GW of new capacity is necessary, requiring an average investment of $19 billion to $33 billion per year over six years in onshore wind, utility-scale solar, battery storage, transmission, and other technologies.62 A three-year freeze would create the planning window for new solar and storage to come online, with wind and transmission investment (which operate on four to seven year timelines) materializing in the years to follow. This investment would come with a federal coordination structure for permitting, procurement, and workforce development that ensures speed-to-power and good jobs. Our modeling indicates that this system would save utility customers and taxpayers roughly $30 billion to $35 billion over 25 years, and would save roughly $8.5 billion relative to a publicly-financed natural gas alternative.63
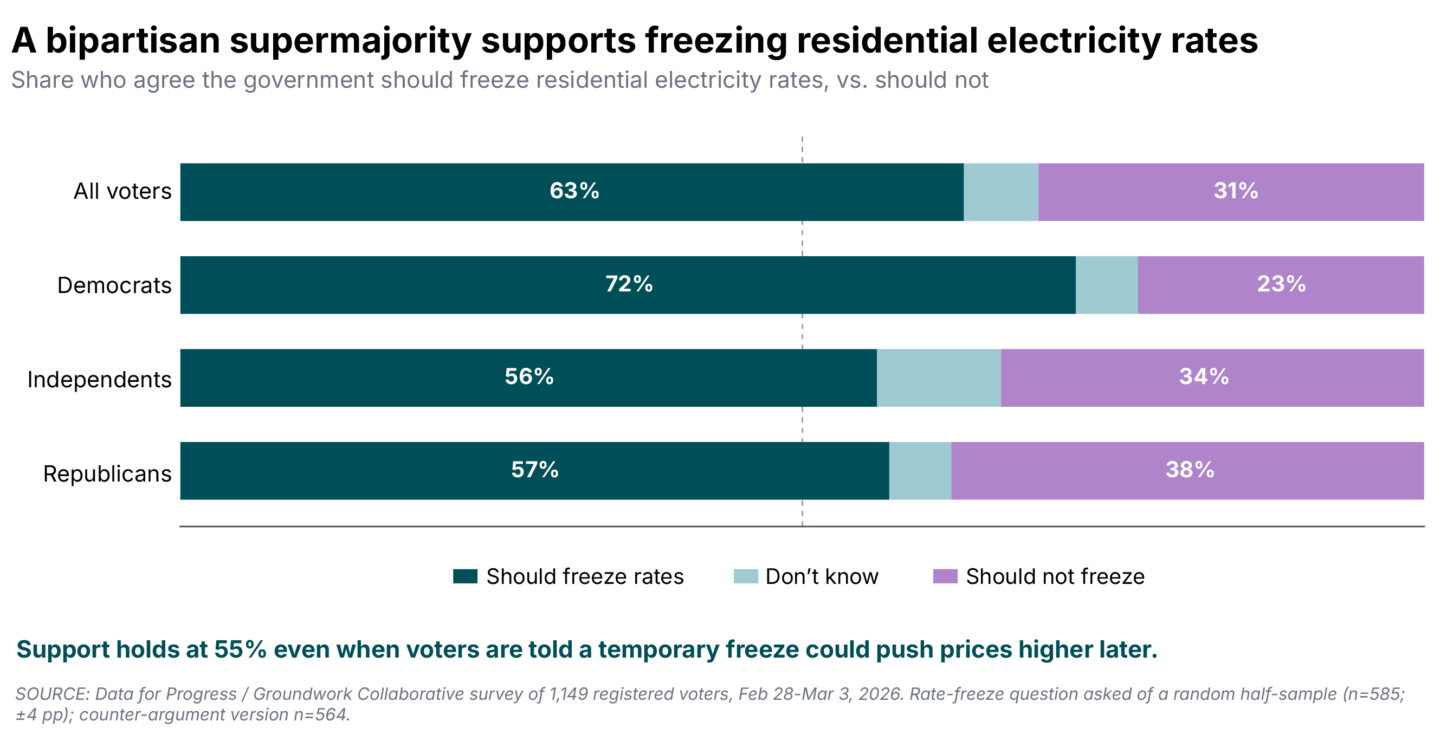
Our polling indicates that a supermajority of voters support a rate freeze, with support holding even as voters in both parties are told that prices will rise later.64
Our modeling indicates that this system would save utility customers and taxpayers roughly $30 billion to $35 billion over 25 years.
Public Power is the Future
Supply-side policies must reckon with two failed hypotheses of previous Democratic energy policymaking: first, that stick-based climate policies can succeed in the absence of complementary industrial policy, and second, that deregulatory and competition-focused programs are the primary way of driving costs down. Instead, we propose a bold policy of direct public investment and planning.
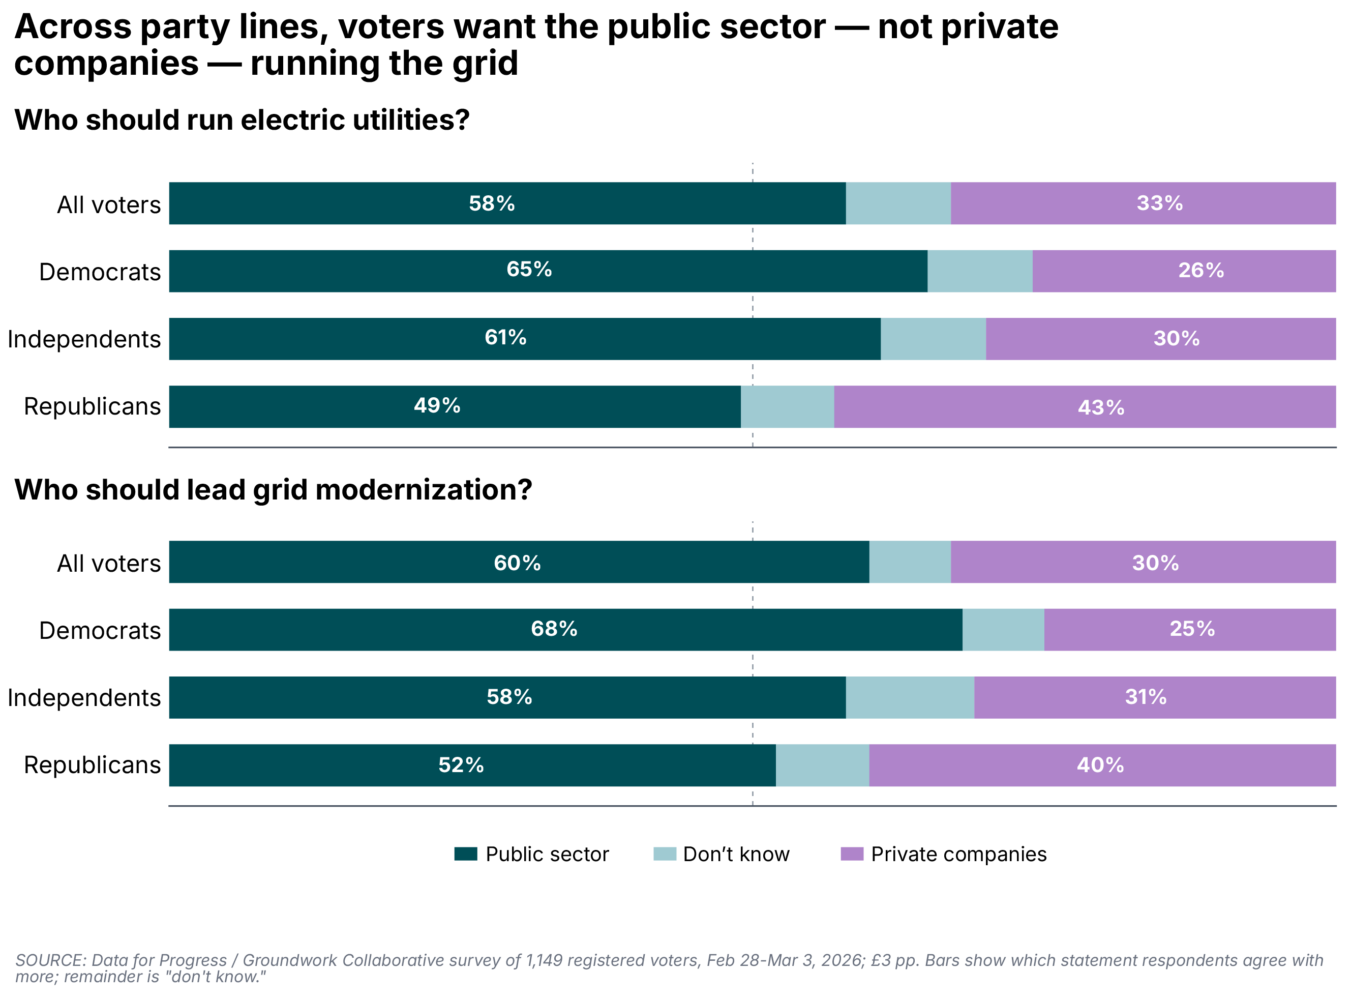
These public power proposals are a departure from decades of grid planning, but they are also popular. A survey by Groundwork showed that the majority of voters prefer public sector leadership on energy, saying the public sector should run both grid modernization (60%) and the utilities themselves (58%). This preference held across all parties, with only one-third of voters overall preferring leadership from private companies.65
The National Power Authority and a Trust Fund for the Grid
At a time when the grid demands rapid modernization and capacity growth, policymakers should leverage public power to expand supply and lower costs. At the federal level, FERC has already made inroads in incentivizing transmission planning with Order 1920, but this remains small-bore compared to what is necessary. Whereas Order 1920 requires utilities and RTOs to submit transmission plans, the federal government remains responsive to individual states and utilities, with no independent planning authority or construction mandate. Order 1920 also runs into the seemingly intractable problem of interstate cost allocation and the patchwork of permitting authorities at the state and federal levels.66
We propose the creation of two new federal institutions:
- The National Power Authority (NPA), a new federal government corporation modeled after the TVA and PMAs to develop, own, and operate generation and transmission infrastructure at national scale, with an explicit mandate to provide affordable, reliable, and increasingly clean electricity to all Americans; and
- The Grid Trust Fund, modeled after existing federal trust funds like the Highway Trust Fund, which would enable more progressive taxation on Big Tech and the wealthy to finance the grid, rather than today’s regressive rate-based model.
Like the PMAs, the NPA would access capital through Treasury-backed financing, eliminating the shareholder return burden that inflates IOU rates.67 It would hold transmission siting authority, cutting through the cost-allocation and state-by-state permitting thickets that have stalled regional grid investment for decades, and build immediately using federal rights-of-way like the Interstate Highway System. This federal siting authority would also cut through the interconnection queue backlogs that currently delay generation development by three to five years in most RTOs.68 The NPA would administer the Grid Trust Fund, capturing co-investment from data centers and other large load customers and channeling them into infrastructure and community investments that benefit all Americans.
Texas has demonstrated that a publicly planned transmission grid can deliver rapid and efficient development. While Texas is often heralded as an example of free market excellence, many of its advantages are actually due to deliberate, centralized planning. In 2005, facing a transmission bottleneck, the Texas legislature directed the Public Utility Commission of Texas (PUCT) and Electric Reliability Council of Texas (ERCOT) to designate wind resource zones. They authorized a $7 billion transmission buildout, which in turn reduced ERCOT wholesale electricity costs by an estimated $21 billion to $31 billion between 2010 and 2022.69 The NPA’s public financing would similarly absorb transmission risk and create the conditions for simplified markets. Where Texas benefited from exceptional wind resources on cheap land in West Texas, a national program could replicate this by connecting complementary resources in the middle of the country with load centers to the south, east, and west.
Rather than simply acting as a passive transmission conduit, the NPA would also play a role in financing, building, and owning emerging clean firm capacity with high up-front capital costs that are well-suited for public investment, such as enhanced geothermal, grid-scale storage, offshore wind, and nuclear power. In this way, the NPA would drive public investment in key generation markets and deliver the firm baseload power that the grid needs to reliably operate, all while creating good union jobs.
Following precedents set by the TVA, the NPA’s Treasury-backed financing mechanisms and revenue bonds can be structured as self-financing instruments, with initial access to the Federal Financing Bank in order to develop independent capital market credibility.70 The NPA would have a mission to deliver affordable, reliable, and clean energy, as well as the authority to plan, site, construct, own, and operate interstate transmission facilities and clean firm generation capacity.
From Regressive to Progressive: The Grid Trust Fund
Federal trust funds with statutory earmarking have funded American infrastructure since the 1950s, including the Highway Trust Fund, the Airport and Airway Trust Fund, the Inland Waterways Trust Fund, and the Harbor Maintenance Trust Fund. Each of these funds works by pairing a revenue source — typically an excise tax on a defined commodity or transaction — with expenditure authority for the intended infrastructure. Despite this history, there is no federal trust fund dedicated to grid infrastructure, even though the grid is one of the largest pieces of national infrastructure and one of the most consequential for affordability, economic growth, and national security.
We propose the creation of a Grid Trust Fund (GTF), which would enable the NPA to seed funds for grid build-out and household relief. Like the Highway Trust Fund, the GTF could be funded through a combination of excise taxes on electricity usage from certain large loads and general fund transfers, as well as co-investment from AI companies. Each of these three revenue streams is more progressive than the current volumetric rate-based model.
Similar to other federal trust funds, the GTF would have statutorily defined expenditure categories, administered by Treasury, with expenditure authority granted to the NPA and other federal agencies where applicable. These would include accounts for interregional transmission, grid resilience, technical assistance, household affordability, insurance against stranded-asset risk, procurement and workforce development, community benefits, distributed resources, and clean firm generation.
Over its first decade of operation, we estimate that the GTF would generate approximately $175 billion in cumulative revenue. The fund alone would spend roughly $50 billion on transmission investment — roughly 15% of current IOU transmission spend — providing a substantial equity grant layer to seed the NPA’s expanded TVA-style bond authority, in addition to existing spending from the Loan Programs Office and private sector.71
Building Smarter While Building Bigger
In addition to investing in transmission and clean firm capacity, federal policy should ensure we exhaust the faster, cheaper options for expanding the capacity of the grid we have today. This includes ensuring investments in virtual power plants (VPPs), distributed energy resources (DERs), energy efficiency, grid-enhancing technologies (GETs), and advanced reconductoring.
Among these low-hanging fruit, VPPs play a critical role. A 2023 study from Brattle Group found that VPPs are capable of delivering capacity at 40% to 60% the cost of alternatives.72 Federal procurement, coordination, and standardization would enable economies of scale beyond the current state-by-state market for DERs and VPPs. Currently, many states, including California, Virginia, and Texas, have successfully led on integrating VPP aggregation and demand response programs. Leveraging the distributed resources account at GTF, a federal program administered by the NPA and Department of Energy (DOE) could complement these state efforts by mandating auto-enrollment of qualifying devices,73 coordinating interstate aggregation and capacity accreditation, standardizing device interoperability, and providing a 50% federal match on software implementation costs.74
Data centers are unique grid customers.
As VPPs and DERs optimize the distribution grid, GETs and advanced reconductoring can optimize the transmission grid. Replacing existing aluminum conductors with advanced composite core or carbon fiber conductors can double the capacity of existing lines in one to three years.75 Meanwhile, GETs such as dynamic line rating systems and power flow controls typically deploy in 12 months or less, can reroute power from congested lines to others with available capacity in real time, and expand effective transmission capacity by 5% to 25%.76 Federal legislation should mandate consideration of GETs and reconductoring alongside new transmission construction on a least-cost basis, and the NPA should fund GET deployment and reconductoring as well as new deployment.
A federal program would also enable solutions to the labor gap that has historically plagued the DER market. Whereas the IRA instituted prevailing wage and apprenticeship requirements for projects exceeding 1 MW, the residential and small-commercial DER market remains largely dominated by non-union contractors. As part of interoperability standardization, a federal program could establish certification requirements linked to completion of a Department of Labor (DOL) Registered Apprenticeship for the installation of these devices, borrowing from the Australian model that uses certification to drive labor standards, rather than union mandates.77 A federal program could also directly require project labor agreements for any DER aggregation programs funded by the federal government, as well as fund relevant DOL Registered Apprenticeship pipelines.
Making Data Centers Pay Their Fair Share
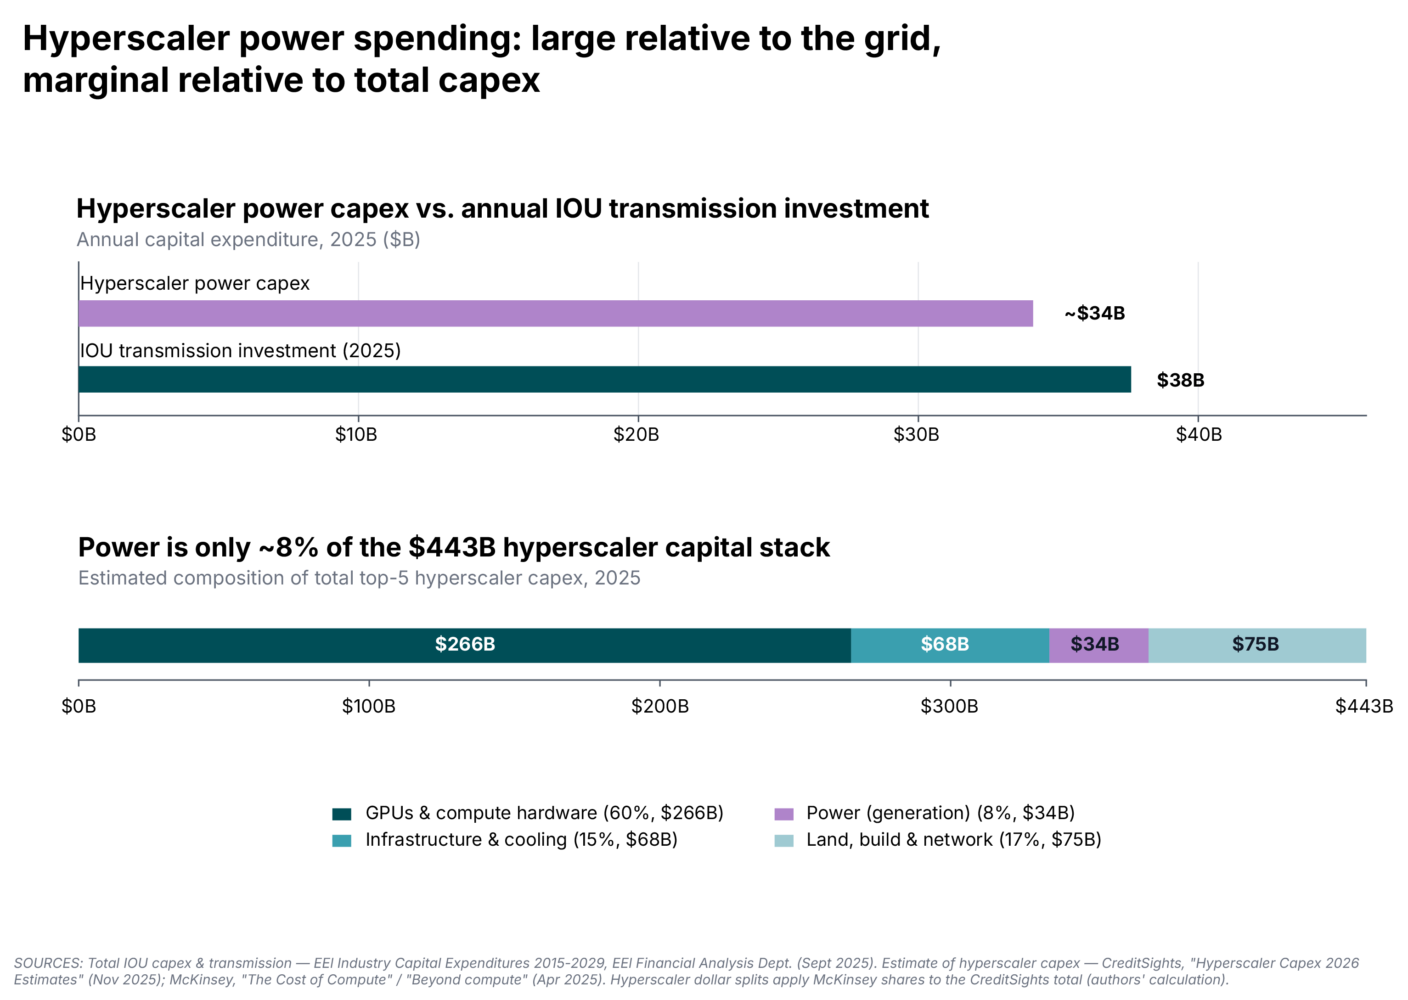
Data centers are unique grid customers. As noted earlier, they bring large load profiles combined with stringent reliability requirements, often requiring more than 99.99% uptime per year.78 While electricity spend for data centers is expected to be on the order of existing utility spend, it is still marginal at 5% to 8% when compared with the rest of the data center capital stack, such as GPUs and cooling.79 This, in turn, means that data center capital is both transformative and more easily subject to public discipline, so long as data centers also have their speed-to-power and reliability needs met. If deployed carelessly, it risks driving up costs for households.
Data centers are also the subject of intense and cross-partisan opposition. A March 2026 poll from Quinnipiac University found that 65% of Americans oppose building a data center in their community, and 55% think that AI will do more harm than good — up 11 percentage points from a previous Quinnipiac poll conducted roughly a year earlier.80 In polling conducted by Groundwork and Data for Progress in February 2026, energy costs were the largest single concern that voters had with new data centers, with 65% of respondents believing that data centers will raise local utility bills.81
Several states across the U.S., including Ohio, Pennsylvania, Missouri, Indiana, Texas, and Virginia, are implementing designated allocated rate classes known as “large load tariffs” for data centers in an effort to ensure that capacity or infrastructure costs for data centers are not spread to other customer classes.82 While concerns around political asymmetry between data centers and other utility customers prevent this from being a foolproof solution, allocated rate classes should be considered a first line of defense and the bare minimum for data centers looking to connect with the grid. We support these concepts but suggest that federal lawmakers think bigger.
Likewise, several states and federal lawmakers have proposed legislation that would incentivize or require data centers to finance their own generation capacity and grid upgrades, whether behind-the-meter or interconnecting elsewhere on the grid.83 So-called “bring your own generation” (BYOG) policies are the bluntest way of disciplining data center capital expenditure, requiring new loads to pair with generation regardless of siting, fuel type, or long-term stranded-asset risk.84 In general, policymakers should consider policies that give the public more agency over capital investment in the grid. As with large load tariffs, BYOG should be considered a bare minimum for ensuring that capital costs do not bleed into other customer classes. Behind-the-meter BYOG policies, in which data center developers pay to build on-site (mostly gas) generation that interconnects only with their new load, should be discouraged or even penalized as they island valuable capacity away from the grid, create health and environmental hazards, and increase emissions.
Lastly, natural gas plants, solar farms, and wind farms all have lifetimes of 20 to 30 years, while today’s GPUs — the most significant portion of a data center’s capital stack — depreciate within three to six years depending on use case. The resulting mismatch creates significant stranded-asset risk for capacity built to serve data center load. Well-structured PPAs already include collateral requirements, but a significant portion of data center power arrangements are signed not by the parent company but by special purpose vehicles (SPVs).
The White House’s March 2026 Ratepayer Protection Pledge, in which seven major Big Tech companies committed voluntarily to pay for contracted power whether or not they ultimately consume it, can also be read to implicitly acknowledge that existing protections are insufficient.85 In either case, federal minimum contract term and collateral requirements would address the gaps left by SPV-level and voluntary commitments.86
A Tax on Large Loads
Since state large load tariffs enable the leverage threat that Big Tech holds over individual state utility commissions, federal lawmakers should consider an excise tax on large loads that would act as a federal floor and feed into the Grid Trust Fund. Lawmakers should implement a federal excise tax on large electricity customers, structured as a per-megawatt-hour (MWh) consumption surcharge on usage above a given threshold. Since the tax would be leveraged on large loads generally, not on data centers specifically, carveouts can be provided for strategic electricity-intensive activities such as aluminum production, furnace steel production, or semiconductor fabrication.
There is strong precedent for such an excise tax. The Internal Revenue Code is full of per-unit federal excise taxes on energy commodities ranging from coal to crude oil. As a wholesale tax on suppliers with earmarked revenues, this proposal most closely mirrors the tax on motor fuels that are deposited in the Highway Trust Fund.
We calculate that such a tax would generate sizable federal revenues. If implemented in fiscal year 2030, we can estimate that data centers and crypto mining will account for approximately 530 terawatt-hours (TWh) in annual consumption87 and that other large-load industries will be responsible for approximately 100 TWh, with approximately 75% of that load subject to strategic carveouts. This leaves a net taxable base of roughly 555 TWh in FY2030.88 At a hypothetical and ambitious federal tax rate of $15/MWh — a loose approximation of the costs currently being shifted on to households and approximately 15% to 30% of base data center electricity costs — this tax would raise roughly $8.3 billion in net annual revenue. Assuming 3% annual growth in the taxable base, the excise tax would raise roughly $95 billion over ten years, sufficient to seed the Grid Trust Fund.89
Being Responsible Users of Electricity
Like a Walmart parking lot on Black Friday, generation capacity is built to handle peak demand, not the average. This means that load flexibility from data centers can have an outsized effect on the generation capacity required.90 A landmark study from Duke University found that 76 GW of new load — equivalent to 10% of the nation’s current aggregate peak demand — could be integrated if data centers can be curtailed for 0.25% of their maximum uptime. The study also found that 126 GW of new load could be accommodated at a curtailment rate of 1%.91 Seeing the benefits of these programs, states such as Texas, Pennsylvania, and California have begun to require or incentivize data centers to engage in demand response or load flexibility programs.92 A DOE study on such programs was included in the FY26 Energy and Water Appropriations Act, and federal lawmakers should consider incentivizing or requiring such programs via subsequent federal legislation.93 FERC has existing authority under the Federal Power Act to require or incentivize demand response programs for large loads in wholesale markets, without new legislation.94
Communities are right to be angry that tech companies with trillion-dollar market caps are cutting deals with state regulators, driving up household bills, and threatening to leave if they don’t get what they want. As a result, state and federal lawmakers on both sides of the aisle are understandably responding with moratoria that would give the public some degree of leverage. AI is projected to generate trillions of dollars in returns, but this political window will not stay open indefinitely. At the very least, federal lawmakers should require these companies to pay full freight for the public infrastructure that stands to make them trillions.
Conclusion
Electricity prices are now rising more than twice as fast as inflation, leading one-third of U.S. households to face high energy burdens. Investor-owned utilities filed record rate increase requests in 2025 — the highest level since the mid-1980s — pointing to continued near-term rate increases absent federal intervention. Meanwhile, Big Tech is paying through the teeth for energy infrastructure that will make them trillions in profit. At a time when our grid demands rapid expansion for electrification and decarbonization, not to mention the massive influx of data centers, lawmakers must find a way to plan and finance the energy system of the 21st century without making working families foot the bill.
Policymakers who treat affordability as a constraint on climate ambition, or vice versa, misunderstand that these priorities are mutually beneficial. Affordability now creates the political conditions for long investment horizons and planning, which in turn ensure long-term affordability. Therefore, this brief proposes a policy architecture that treats affordability and structural reform as mutually reinforcing:
- Rate freezes and price stabilization will offer immediate relief at the kitchen table and build the political foundation on which durable supply-side reform depends.
- Bold supply-side policies, such as the National Power Authority and the Grid Trust Fund, will enable us to plan, finance, and build the grid at the scale required.
- A compact with data center developers will ensure that Big Tech is paying its fair share for a public grid.
Today, American families are paying for the decades of tinkering at the edges of a broken system that drives profits to Big Tech, a handful of private energy companies, and utility shareholders. The energy market has never been a free market. Like it has before, it is time for the federal government to once again boldly invest in federal planning, public financing, and a grid that delivers affordable energy for all.
“I am a lineman for the county
And I drive the main road
Searchin’ in the sun for another overload.
I hear you singing in the wire
I can hear you through the whine
And the Wichita lineman
Is still on the line.”
Glen Campbell, “Wichita Lineman”
Author
Grayson Flood previously served as legislative director and policy adviser to Congresswoman Alexandria Ocasio-Cortez, where he managed the congresswoman’s legislative portfolio; advised on issues spanning energy, labor, housing, and trade; and informed her work on the House Committees on Energy & Commerce and Natural Resources.
Prior to Congresswoman Ocasio-Cortez’s office, Grayson held various roles in the non-profit and private energy sectors as well as policy and leadership positions for a number of successful state legislative and electoral campaigns. He holds a degree in computer science from the University of California, Berkeley.
Acknowledgements
Advait Arun, Zoe Butler, Johanna Bozuwa, Ted Fertik, Alex Jacquez, Michelle Moore, Marissa Paslick Gillett, Elizabeth Pancotti, Jigar Shah, Fred Stafford, Isabella Weber, and others for their review and feedback. Matt Ingram provided graphic design, Conor Smyth provided support with financial modeling, and Mary Kate Lambert provided editorial support.
Endnotes
[1] Data for Average Retail Price of Electricity, Residential Sector, Electricity Data Browser, U.S. Energy Information Administration, n.d., https://www.eia.gov/electricity/data/browser/.
[2] PowerLines, Utility Bills Are Rising: 2025 Review (January 29, 2026), https://powerlines.org/utilities-requested-record-31-billion-in-rate-increases-in-2025-double-that-of-2024/; Akshay Thyagarajan, Jamie Friedman, and Amanda Levin, “Electric and Natural Gas Utility Rate Hikes Tracker,” Center for American Progress, December 8, 2025, last updated March 26, 2026, https://www.americanprogress.org/article/electric-and-natural-gas-utility-rate-hikes-tracker/.
[3] Data for Question 7: Compared to previous years, has your monthly electricity bill gone up, down, or stayed the same in the last 12 months, Utilities Survey, Data for Progress and Groundwork Collaborative, February 28, 2026-March 3, 2026, https://www.filesforprogress.org/datasets/2026/3/dfp_gwc_utilities_tabs.pdf.
[4] Data for Progress and Groundwork Collaborative, Utilities Survey; Julie Margetta Morgan, Mike Pierce, and Eduard Nilaj, “Fueling Debt: How Rising Utility Costs Are Overwhelming American Families,” The Century Foundation, November 17, 2025, http://tcf.org/content/commentary/fueling-debt-how-rising-utility-costs-are-overwhelming-american-families/.
[5] Data for Average Retail Price of Electricity, Residential Sector, U.S. Energy Information Administration.
[6] PJM, “PJM To Lead Market Reform Effort To Support Generation Investment and Reliability,” PJM Inside Lines, May 6, 2026, https://insidelines.pjm.com/pjm-to-lead-market-reform-effort-to-support-generation-investment-and-reliability/.
[7] Richard F. Hirsh, “Revising the Traditional Interpretation of Rural Electrification,” Newsroom, Johns Hopkins University Press, June 3, 2022, https://www.press.jhu.edu/newsroom/revising-traditional-interpretation-rural-electrification.
[8] Daniel Yergin, The Prize: The Epic Quest for Oil, Money, and Power (Simon & Schuster, 1991).
[9] Julie A. Cohn, The Grid: Biography of an American Technology (Cambridge, MA: MIT Press, 2017), esp. chaps. 6–8 (on the National Power Survey, the 1965 blackout, and the emergence of reliability coordination).
[10] Kelsey Brugger, “It Was A ‘Sledgehammer’ After All,” E&E News by POLITICO, May 13, 2025, https://www.eenews.net/articles/it-was-a-sledgehammer-after-all/.
[11] Harvey Averch and Leland L. Johnson, “Behavior of the Firm Under Regulatory Constraint,” The American Economic Review 52, no. 5 (1962): 1052–69, http://www.jstor.org/stable/1812181. Note that although the Averch-Johnson effect is well-documented in political thought, evidence of its effects with respect to utilities are debated.
[12] Sharon Beder, Power Play: The Fight to Control the World’s Electricity (The New Press, 2003).
[13] Severin Borenstein and James Bushnell, “The U.S. Electricity Industry After 20 Years of Restructuring,” Annual Review of Economics 7 (2015): 437–463, https://doi.org/10.1146/annurev-economics-080614-115630.
[14] Bank of America Institute, “Power Check: Watt’s Going On with the Grid?” Transformation series, July 22, 2025, https://institute.bankofamerica.com/content/dam/transformation/us-electrical-grid.pdf.
[15] U.S. Department of Energy, National Transmission Planning Study, Executive Summary (U.S. Department of Energy, 2024), https://www.energy.gov/oe/national-transmission-planning-study-0.
[16] Idaho National Laboratory, Advanced Conductor Scan Report, INL/RPT-23-50856 (December 2023, revision 2 September 2024), https://inl.gov/content/uploads/2024/10/23-50856_R12a_-AdvConductorsScanProjectReportCompressed.pdf.
[17] Bank of America Institute, “Power Check: Watt’s Going On with the Grid?”
[18] California: Insurance Journal, “California Utility Bills Are 20% Higher Due to Wildfires,” April 13, 2026, https://www.insurancejournal.com/news/west/2026/04/13/865378.htm (PG&E wildfire-related surcharges average ~$41/month, ~19% of the residential bill — roughly $490/year). Florida: “Florida PSC Approves $1.2 Billion in FPL Hurricane Restoration Charges,” Renewable Energy World, December 2024, https://www.renewableenergyworld.com/power-grid/outage-management/florida-psc-approves-1-2-billion-in-fpl-hurricane-restoration-charges/ (residential storm-restoration surcharge of $12.02/month through 2025). Maine: “CMP Seeks $228 Million for 2024 Storm Repair Costs,” Portland Press Herald, February 28, 2025, https://www.pressherald.com/2025/02/28/cmp-seeks-228-million-for-2024-storm-repair-costs/ (2024 storm recovery ≈ $20/month on the average residential bill).
[19] Edison Electric Institute, “Industry Capital Expenditures, 2015–2029,” EEI Financial Analysis Department (updated September 2025), https://www.eei.org/-/media/Project/EEI/Documents/Issues-and-Policy/Finance-And-Tax/Industry-Capital-Expenditures.pdf.
[20] Edison Electric Institute, 2024 Financial Review: Annual Report of the U.S. Investor-Owned Electric Utility Industry, EEI Financial Analysis Department, “Total Assets, 2015–2024,” https://www.eei.org/-/media/Project/EEI/Documents/Issues-and-Policy/Finance-And-Tax/Financial_Review/FinancialReview_2024.pdf; EEI, “Industry Capital Expenditures, 2015–2029.”
[21] Chris Seiple, Ben Hertz-Shargel, and Simon Flowers, “Supply Chain Bottlenecks Threaten U.S. Data Centre Power Ambitions,” Wood Mackenzie, July 29, 2025, https://www.woodmac.com/news/opinion/supply-chain-bottlenecks-threaten-us-data-centre-power-ambitions/.
[22] There have been five events since 2011 which featured significant levels of unplanned outages due to mechanical freezing and fossil fuel issues. Most recently, in 2021, following Winter Storm Uri, Texas, Oklahoma and Louisiana saw 50%-plus declines, with Texas the most impacted with a 70.1% decline. Then, following Winter Storm Elliott in 2022, the Marcellus and Utica Shale formations of the Appalachian Basin declined by 23% and 54%, respectively. In each of these cases, the vast majority of declines were due to freeze-offs within the wellheads or pipelines, and in some cases due to blocked roads or frozen equipment. Federal Energy Regulatory Commission, Inquiry into Bulk-Power System Operations During December 2022 Winter Storm Elliott: FERC, NERC, and Regional Entity Staff Report (October 2023), https://www.ferc.gov/media/winter-storm-elliott-report-inquiry-bulk-power-system-operations-during-december-2022.
[23] Ryan Wiser et al., “Factors Influencing Recent Trends in Retail Electricity Prices in the United States,” The Electricity Journal 38, no. 4 (2025): https://doi.org/10.1016/j.tej.2025.107516.
[24] Ibid.
[25] Jenya Kahn-Lang, “Competing for (In)Attention: Price Discrimination in Residential Electricity Markets,” Working Paper No. 333 (Energy Institute at Haas, November 2022), https://haas.berkeley.edu/wp-content/uploads/WP333.pdf.
[26] U.S. Department of Energy, “Low-Income Energy Affordability Data (LEAD) Tool,” dataset, n.d., https://www.energy.gov/scep/slsc/lead-tool.
[27] Kenneth Sercy and Liza Reed, “The Arithmetic of Availability: Prospects for American Grid Dominance in 2030,” Niskanen Center, November 25, 2025, https://www.niskanencenter.org/the-arithmetic-of-availability-prospects-for-american-grid-dominance-in-2030/.
[28] This era is best personified by the career of Samuel Insull, Thomas Edison’s former personal secretary, who built a vast pyramid of interlocking utility holding companies that at its peak controlled roughly one-eighth of the electricity generated in the United States. When the holding company structure collapsed in 1932 amid the Great Depression, it wiped out the savings of over 600,000 investors and became one of the most spectacular corporate failures in American history. Insull fled to Europe to avoid prosecution, was eventually extradited from Greece, and was tried on charges of mail fraud and embezzlement. His career bookended the era of unregulated private utility consolidation and was a direct catalyst for the Public Utility Holding Company Act of 1935.
[29] Richard Brent, “Public Utility Holding Company Act of 1935 (PUHCA),” EBSCO Research Starters, 2023, https://www.ebsco.com/research-starters/law/public-utility-holding-company-act-1935-puhca.
[30] Brandon McBride, “Celebrating the 80th Anniversary of the Rural Electrification Administration,” U.S. Department of Agriculture, May 20, 2016, https://www.usda.gov/about-usda/news/blog/celebrating-80th-anniversary-rural-electrification-administration.
[31] Peter Braestrup, “National Power Survey Is Urged as Step to Cut Consumer Costs,” The New York Times, January 24, 1962, https://timesmachine.nytimes.com/timesmachine/1962/01/24/89831718.html?pageNumber=16.
[32] Beder, Power Play.
[33] Alexander MacKay and Ignacia Mercadal, “Deregulation, Market Power, and Prices: Evidence from the Electricity Sector,” Working Paper 2022-008 (Center for Energy and Environmental Policy Research, Massachusetts Institute of Technology, April 2022), https://ceepr.mit.edu/wp-content/uploads/2022/04/2022-008.pdf.
[34] Dell’Oro Group, “AI Boom Drives Data Center Capex to $1.7 Trillion by 2030,” February 11, 2026, https://www.delloro.com/news/ai-boom-drives-data-center-capex-to-1-7-trillion-by-2030/.
[35] U.S. Department of Energy, National Transmission Planning Study.
[36] Ryan Wiser et al., “Retail Electricity Price Trends and Drivers: Data Update — 2026 Edition” (Lawrence Berkeley National Laboratory and The Brattle Group, April 2026), https://eta-publications.lbl.gov/sites/default/files/2026-03/retail_price_trends_2026_edition.pdf; U.S. Department of the Treasury, “Daily Treasury Par Yield Curve Rates,” Daily Treasury Rates, 2026, https://home.treasury.gov/resource-center/data-chart-center/interest-rates/TextView?type=daily_treasury_yield_curve&field_tdr_date_value=2026.
[37] U.S. Department of Energy, National Transmission Planning Study.
[38] “Industry Data,” Edison Electric Institute, n.d., https://www.eei.org/en/resources-and-media/industry-data.
[39] 2024 Financial Review: Annual Report of the U.S. Investor-Owned Electric Utilities (Edison Electric Institute, October 2025), https://www.eei.org/-/media/Project/EEI/Documents/Issues-and-Policy/Finance-And-Tax/Financial_Review/FinancialReview_2024.pdf; Infrastructure Monitor 2024 (World Bank Group, 2025), https://documents1.worldbank.org/curated/en/099042225161529126/pdf/P506950-cf58d140-f416-4bb5-be00-6ac692b8c5c2.pdf; Robert Poole, “Toll Concession Public Private Partnerships: Frequently Asked Questions,” Reason Foundation, October 5, 2016, https://reason.org/faq/toll-concession-public-private-partnerships-frequently-asked-questions/.
[40] An Act to Amend the Tennessee Valley Authority Act of 1933, As Amended, and For Other Purposes, Pub. L. No. 86-137, 73 Stat. 338 (1959), https://www.congress.gov/bill/86th-congress/senate-bill/2471/text.
[41] Data for Progress and Groundwork Collaborative, Utilities Survey; PowerLines, Utility Bills Are Rising: 2025 Review.
[42] Isabella Weber, “Could Strategic Price Controls Help Fight Inflation?,” The Guardian, December 29, 2021, https://www.theguardian.com/business/commentisfree/2021/dec/29/inflation-price-controls-time-we-use-it.
[43] Brian C. Albrecht, Alex Tabarrok, and Mark Whitmeyer, “Chaos and Misallocation Under Price Controls,” Working Paper (March 27, 2026), https://briancalbrecht.com/Albrecht_Tabarrok_Whitmeyer_Price_Controls.pdf.
[44] Kahn-Lang, “Competing for (In)Attention.”
[45] Norwegian Office of the Prime Minister, Norwegian Ministry of Energy, and Norwegian Ministry of Finance, “Government Launches Electricity Support Package Worth Billions,” press release, December 11, 2021, https://www.regjeringen.no/en/whats-new/government-launches-electricity-support-package-worth-billions/id2891839/.
[46] Norwegian Ministry of Energy, “‘Norway Price’ to Ensure Predictable and Stable Electricity Prices for Consumers,” press release, March 17, 2025. https://www.regjeringen.no/en/whats-new/norgespris-skal-sikre-forutsigbare-og-stabile-strompriser-for-folk/id3090849/.
[47] Norwegian Ministry of Energy, “Complaint Concerning Norway Price for Electricity – Case No. 94448,” December 15, 2025, https://www.regjeringen.no/contentassets/7c52e5c1f5274553a69f66092566c896/response-to-complaint-concerning-norway-price-for-electricity-case-no.-94448-updated-references-.pdf.
[48] On peak demand days LNG is up to 35% of New England’s gas supply. U.S. Energy Information Administration, “New England Natural Gas and Electricity Prices Increase on Supply Constraints, High Demand,” Today in Energy, February 3, 2022, https://www.eia.gov/todayinenergy/detail.php?id=51158.
[49] Sharon Udasin, “New England Grapples with Sky-High Electricity Rates as Ukraine War Squeezes Gas Supply,” The Hill, January 8, 2023, https://thehill.com/policy/equilibrium-sustainability/3802915-new-england-grapples-with-sky-high-electricity-rates-as-ukraine-war-squeezes-gas-supply/; New England residential average rate in 2021: 21.51¢/kWh; in 2023: 28.73¢/kWh. U.S. Energy Information Administration, “Table 2.10. Average Price of Electricity to Ultimate Customers by End-Use Sector, by State,” Electric Power Annual, 2022 ed. and 2024 ed., https://www.eia.gov/electricity/annual/.
[50] U.S. Energy Information Administration, “2024 Total Electric Industry – Average Retail Price (cents/kWh),” table 4, Electric Sales, Revenue, and Average Price, 2025, https://www.eia.gov/electricity/sales_revenue_price/pdf/table_4.pdf.
[51] The fixed (“freeze”) rate in each year is set as the three-year rolling average of New England residential electricity rates over the three preceding years, with each prior-year rate restated in the current year’s dollars using the CPI-U (U.S. Bureau of Labor Statistics). New England residential rates are from the EIA Electric Power Annual, Table 2.10: 21.25¢/kWh (2020), 21.51¢/kWh (2021), and 24.73¢/kWh (2022). Restated to 2023 dollars (CPI-U of 258.811, 270.970, and 292.655 against 304.702 in 2023), these become 25.02¢, 24.19¢, and 25.75¢/kWh, for an average freeze rate of approximately 24.99¢/kWh — about 25¢/kWh — in 2023.
[52] Massachusetts and Rhode Island residential rates approached roughly 33–34¢/kWh at the 2023 peak (EIA state electricity data). Against the 2023 freeze rate of approximately 25¢/kWh (note 51), this is a gap of about 8.5¢/kWh. Applied to average residential consumption of roughly 580 kWh per month (≈6,960 kWh per year), an enrolled household would have saved about 8.5¢/kWh × 6,960 kWh ≈ $590 — approximately $600 — over the year.
[53] Annual fund payouts are estimated as the number of enrolled households — 1.375 million, or 25% of approximately 5.5 million New England residential customers — multiplied by average monthly consumption (580 kWh), twelve months, and the gap between the prevailing market rate and the freeze rate (note 51). That gap (market minus freeze) is 0.93¢/kWh in 2022, 3.75¢/kWh in 2023, 0.68¢/kWh in 2024, and 0.31¢/kWh in 2025, producing payouts of approximately $89 million, $358 million, $66 million, and $30 million, respectively; the 2026 figure is prorated through April (the latest month available) and is slightly negative (note 55). Cumulative payouts from 2022 through mid-2026 total approximately $535 million, peaking at roughly $358 million in the 2023 crisis year. Market rates are from the EIA Electric Power Annual, Table 2.10 (2022–2024) and EIA Electric Power Monthly (2025–2026); CPI-U from the U.S. Bureau of Labor Statistics.
[54] By 2025 the three-year rolling average underlying the freeze rate incorporates the elevated 2022–2024 rates. Restating the 2022, 2023, and 2024 New England residential rates (24.73¢, 28.73¢, and 27.68¢/kWh) to 2025 dollars (CPI-U of 292.655, 304.702, and 313.689 against 321.943 in 2025) yields 27.20¢, 30.35¢, and 28.41¢/kWh, for an average freeze rate of approximately 28.7¢/kWh in 2025. The 2025 and 2026 market rates (28.97¢ and 30.01¢/kWh) are from EIA Electric Power Monthly for the New England census division, with the 2026 value proxied by the April 2026 monthly figure.
[55] By 2026 the freeze rate reaches approximately 30.25¢/kWh, modestly above the prevailing market rate of roughly 30.01¢/kWh. The gap thus turns negative (about −0.24¢/kWh): enrolled households pay marginally more under the freeze than at market, reversing the net flow so the fund begins to replenish reserves (an estimated −$7.7 million for the partial year through April 2026).
[56] Georgia Public Service Commission, “Commissioners Approve Three-Year Rate Freeze for Georgia Power,” July 2025, https://psc.ga.gov/site/assets/files/8840/media_advisory_2025_gp_rate_freeze_approval.pdf; see also Georgia PSC, “PSC and Georgia Power Agreement: Three-Year Freeze of Base Rates,” https://psc.ga.gov/newsroom/newsreleases/psc-and-georgia-power-agreement-three-year-freeze-of-base-rates/. Georgia Public Service Commission, stipulated agreement (December 2025) ensuring large-energy users such as data centers cover their own costs and shield residential and small commercial customers from new generation and transmission costs. Reported in Georgia Recorder, “Last-Minute Surprise Agreement with Georgia Power…,” December 10, 2025, https://georgiarecorder.com/2025/12/10/psc-hearings-disrupted-by-protestors-after-surprise-agreement-with-georgia-power/.
[57] New Jersey Governor Mikie Sherrill, Executive Order No. 1 (January 20, 2026), https://www.nj.gov/infobank/eo/057sherrill/pdf/EO-1.pdf.
[58] U.S. Energy Information Administration, “2024 Average Monthly Bill- Residential,” table 5A, Electric Sales, Revenue, and Average Price, 2025, https://www.eia.gov/electricity/sales_revenue_price/pdf/table_5a.pdf; National Energy Assistance Directors’ Association, “Energy Price Update (11/19/25): Electric Prices Up by 10.5% Since January 2025,” November 19, 2025, https://neada.org/wp-content/uploads/2025/11/EnergypricesNov25.pdf.
[59] Estimated residential household counts for likely-enrolling utilities: PSEG NJ (2M), PECO PA (1.7M), BGE MD (1.4M), PHI/Pepco group MD/DC/DE (1.6M), PPL Electric PA (1.5M): subtotal PJM Mid-Atlantic 8.2M (U.S. Energy Information Administration, Annual Electric Power Industry Report, Form EIA-861 Detailed Data Files, 2024, https://www.eia.gov/electricity/data/eia861/; Exelon Corporation, Annual Report on Form 10-K for the Fiscal Year Ended December 31, 2025, filed February 12, 2026, SEC accession no. 0001109357-26-000018, https://www.sec.gov/Archives/edgar/data/0001109357/000110935726000018/exc-20251231.htm.; PPL Corporation, 2024 Annual Report, February 2025, https://filecache.investorroom.com/mr5ir_pplweb2/1207/PPL_2024_Annual_Report.pdf.); Eversource CT/MA/NH (3.4M) and National Grid US MA/RI/NY (2.5M): subtotal New England/NY 5.9M (Eversource Energy, Annual Report on Form 10-K for the Fiscal Year Ended December 31, 2024, filed February 14, 2025, SEC accession no. 0000072741-25-000007, https://www.sec.gov/Archives/edgar/data/72741/000007274125000007/es-20241231.htm; National Grid, US Databook, May 2025, https://www.nationalgrid.com/document/560026/download.); PG&E CA (5.6M) and SCE/Edison International CA (4.6M): subtotal California 10.2M (PG&E Corporation and Pacific Gas and Electric Company, 2024 Joint Annual Report to Shareholder, February 12, 2025, https://s21.q4cdn.com/673114418/files/doc_financials/2024/ar/2024-PG-E-Joint-Annual-Report-to-Shareholders.pdf; Edison International and Southern California Edison, 2024 Annual Report, December 31, 2024, https://download.edison.com/406/files/202503/2024-eix-sce-annual-report.pdf.); ConEdison NY (3.7M): subtotal New York 3.7M (Consolidated Edison, Inc., 2024 Annual Report, December 31, 2024, https://investor.conedison.com/static-files/073e9f06-6a6e-4082-8d23-c7e969b39977.); total 28M.
[60] Three-year savings are estimated as the cumulative gap between a frozen rate and a market rate rising ~6% per year, equal to about 37% of one year’s bill (savings of 6.0%, 12.4%, and 19.1% of the baseline bill in years one, two, and three). Applied to average residential bills in the affected regions (~$1,540–$1,890 per year, from EIA per-household residential consumption of ~6,000–12,500 kWh at rates of $0.15–$0.30/kWh), this yields three-year savings of roughly $575–$710, averaging about $650 per household. Higher-consumption households save proportionally more: reaching $1,000 requires an annual bill near $2,670 (~$222/month), above the average in even the highest-cost states. U.S. Energy Information Administration, Electric Power Annual and State Electricity Profiles, 2023–2024.
[61] The four conservative scenario regions account for approximately 24% of national residential electricity load based on EIA state-level sales data (U.S. Energy Information Administration, Form EIA-861, 2024.). The 29% demand growth share reflects an upward adjustment for disproportionate data center concentration: PJM’s independent market monitor attributed 63% of the 2025/26 capacity auction price increase to data center demand (Monitoring Analytics, 2025 State of the Market Report for PJM, March 12, 2026, https://www.monitoringanalytics.com/reports/PJM_State_of_the_Market/2025.shtml.), and Northern Virginia alone hosts over 35% of total U.S. data center capacity (CBRE, North America Data Center Trends H2 2024, February 26, 2025, https://www.cbre.com/insights/reports/north-america-data-center-trends-h2-2024.), the majority of which falls within the PJM footprint. The 29% figure is an authors’ estimate and should be treated as illustrative.
[62] The 30GW to 60 GW range represents 29% of the Niskanen Center’s projected national demand growth of 103 GW to 197 GW by 2030 (Sercy and Reed, “The Arithmetic of Availability.”); investment costs are estimated using NREL Annual Technology Baseline 2024 moderate scenario costs (2022 base year dollars): onshore wind at $1,489/kW, utility-scale solar at $1,343/kW (NREL ATB 2024, moderate, 2025–2030 average), and four-hour battery storage at $300/kWh (Wesley Cole et al., “Cost Projections for Utility-Scale Battery Storage: 2025 Update,” National Laboratory of the Rockies (2025): https://research-hub.nlr.gov/en/publications/cost-projections-for-utility-scale-battery-storage-2025-update/.); transmission estimated at approximately $670 million per GW of new firm capacity: roughly 400–500 miles of 500-kV AC at the per-MW-mile cost basis used in the NREL National Transmission Planning Study (2024) and WECC (2019), the Study itself reporting system-cost savings and expansion multiples rather than a cost per GW; an additional ~$29 billion is added for New England and New York to reflect the higher cost of offshore wind (~$4,640/kW fixed-bottom, ATB 2024) relative to onshore alternatives.
[63] All figures are present values over a 25-year horizon, discounted at ~2.4% real (4.96% nominal: the ~5.0% 30-year Treasury yield less ~2.5% expected inflation), for meeting the conservative-scenario regional capacity shortfall of approximately 44 GW; capital costs are in 2022 real dollars from the NREL Annual Technology Baseline 2024 (moderate scenario). Public financing is assumed at the Treasury rate, so public capital enters at its overnight cost. Scenario C (public financing, renewables) totals ~$162 billion: 35 GW onshore wind at $1,489/kW, 23 GW utility-scale solar at $1,343/kW, 70 GWh battery storage at $300/kWh, transmission at ~$670M/GW (≈400–500 miles of 500-kV AC at the per-MW-mile cost basis of the NREL National Transmission Planning Study, 2024), and a ~$29 billion offshore-wind premium for New England and New York reflecting ATB 2024 fixed-bottom costs of ~$4,640/kW; zero fuel cost. Scenario B (public financing, gas) totals ~$171 billion: $63 billion overnight capital for 44 GW of combined-cycle gas at $1,433/kW, plus ~$108 billion present-value fuel cost (a 25-year stream at a ~$3.8/MMBtu real average from EIA Annual Energy Outlook 2025, 60% capacity factor, 6,500 BTU/kWh heat rate). Scenario A (status-quo IOU financing, gas) totals ~$195 billion: the same fuel cost plus a ~$87 billion present-value capex recovery, computed as the 25-year regulated revenue requirement on the $63 billion gas investment — straight-line depreciation plus a 9.28% pre-tax weighted return on the declining rate base (50/50 debt-equity, 9.7% authorized ROE grossed up for a 25.7% income-tax rate, 5.5% cost of debt). Savings are therefore ~$8.5 billion (Scenario C vs. B) and ~$32.5 billion (Scenario C vs. A).
[64] Data for Progress and Groundwork Collaborative, Utilities Survey.
[65] Data for Progress and Groundwork Collaborative, Utilities Survey.
[66] Rachel Levine and Swad Sathe, “What’s Next? Breakthroughs and Roadblocks in Electric Transmission Regulation,” Niskanen Center, February 14, 2025, https://www.niskanencenter.org/whats-next-breakthroughs-and-roadblocks-in-electric-transmission-regulation/.
[67] Chirag Lala and Yakov Feygin, “Research Note: Evaluating the Impacts from Reducing Equity in Investor-Owned Utility Capital Stacks in California,” Center for Public Enterprise, August 28, 2025, https://publicenterprise.org/report/research-note-evaluating-the-impacts-from-reducing-equity-in-investor-owned-utility-capital-stacks-in-california/.
[68] Alisa Petersen, Katie Siegner, and John Coequyt, “The Interconnection Queue Continues to Be a Barrier to American Economic Competitiveness,” RMI, March 17, 2026, https://rmi.org/interconnection-reform-ai-data-centers-generator-queues/.
[69] 2022 State of the Market Report for the ERCOT Electricity Markets (Potomac Economics, May 2023), https://www.potomaceconomics.com/wp-content/uploads/2023/05/2022-State-of-the-Market-Report_Final_060623.pdf; Texas Comptroller of Public Accounts, “Wind Power: Energy is Good for Texas” (2023), https://comptroller.texas.gov/economy/economic-data/energy/2023/wind.php; Joshua D. Rhodes, “The Impact of Renewables in ERCOT (2022 Q4 Update)” (IdeaSmiths LLC, April 2023), https://static1.squarespace.com/static/652f1dc02732e6621adb2a3a/t/654c1889d23c9b5e380aa6bf/1699485834626/Impact-of-Renewables-in-ERCOT_FINAL.pdf.
[70] An Act to Amend the Tennessee Valley Authority Act of 1933, As Amended, and For Other Purposes, Pub. L. No. 86-137, 73 Stat. 338 (1959), https://www.congress.gov/bill/86th-congress/senate-bill/2471/text.
[71] The ~$175 billion reflects cumulative FY2030–2039 revenue from the GTF’s four streams: ~$95 billion from the large-load excise tax ($15/MWh on a ~555 TWh base growing 3% annually), ~$40 billion in general-fund transfers ($4 billion/year), a ~$20 billion one-time capitalization, and ~$20 billion in voluntary hyperscaler co-investment ($2 billion/year). Of this, roughly $50 billion (about $5 billion per year, or ~15% of the ~$33 billion in current annual IOU transmission investment (EEI, 2024)) is allocated to transmission, forming an equity layer that leverages the NPA’s ~$250 billion in TVA-style bond authority.
[72] When avoided generation, transmission, and distribution costs are accounted for. VPP capacity is already around 30GW-60GW, and studies have shown that VPPs could address 10%-20% of peak capacity by 2030, saving roughly $10 billion per year.
[73] This should include an opt-out, and would apply to devices such as smart thermostats, heat pumps, EV chargers, water heaters, behind-the-meter batteries, etc.
[74] By targeting the software layer, rather than hardware procurement, this program could ensure that utilization commitments for dynamic pricing programs, demand response, and customer engagement are met. This was a primary lesson from the ARRA Smart Grid Investment Grant (SGIG) program, where smart meters were deployed at scale but did not meet utilization targets.
[75] Idaho National Laboratory has identified that 20% of U.S. transmission lines are candidates for such reconductoring.
[76] T. Bruce Tsuchida, Stephanie Ross, and Adam Bigelow, Unlocking the Queue with Grid-Enhancing Technologies: A Case Study of the Southwest Power Pool, Final Report (Public Version) (The Brattle Group, prepared for the WATT Coalition, February 1, 2021), 18, https://watt-transmission.org/unlocking-the-queue/.
[77] Victoria’s Fair Jobs Code drives high labor standards through certification rather than union-agreement mandates. To tender for government contracts of $1 million or more, suppliers must hold a Fair Jobs Code “pre-assessment certificate” demonstrating compliance with employment, industrial-relations, and workplace-health-and-safety standards, including secure and direct employment, fair wages and conditions, and workers’ right to be represented by the organization of their choice. By attaching standards to public funding rather than to union representation, it sets a wage-and-conditions floor that covers every worker on a project, union and non-union alike, and applies uniformly across all contractors and their subcontractors. It binds public investment directly to good jobs, is simpler to enforce than project-by-project negotiation, and is less exposed to the legal and political challenges that have repeatedly stalled union-mandate approaches in the United States. Victorian Government, “Fair Jobs Code: Fact Sheet,” BuyingFor Victoria, updated September 1, 2024, https://www.buyingfor.vic.gov.au/fair-jobs-code-fact-sheet.
[78] CoreSite, “Breaking Down Data Center Tier Level Classifications,” 2024, https://www.coresite.com/blog/breaking-down-data-center-tiers-classifications.
[79] Jesse Noffsinger et al., “The Cost of Compute: A $7 Trillion Race to Scale Data Centers,” McKinsey Quarterly, McKinsey & Company, April 28, 2025, https://www.mckinsey.com/industries/technology-media-and-telecommunications/our-insights/the-cost-of-compute-a-7-trillion-dollar-race-to-scale-data-centers.
[80] Quinnipiac University, “The Age of Artificial Intelligence: Americans’ AI Use Increases While Views on It Sour, Quinnipiac University Poll On AI Finds; 7 in 10 Think AI Will Cut Jobs With Gen Z the Most Pessimistic,” March 30, 2026, https://poll.qu.edu/poll-release?releaseid=3955.
[81] Data for Progress and Groundwork Collaborative, Utilities Survey.
[82] Natalie Mims Frick and Long Lam, “Large Loads: Interconnection, Tariff Designs, and State Actions,” presentation, American Public Power Association Business and Finance Conference, Lawrence Berkeley National Laboratory and The Brattle Group, September 8, 2025, brattle.com/wp-content/uploads/2025/09/Large-Loads-Interconnection-Tariff-Designs-and-State-Actions.pdf.
[83] Ivan Penn and Karen Weise, “State and Federal Lawmakers Want Data Centers to Pay More for Energy,” The New York Times, January 15, 2026, https://www.nytimes.com/2026/01/15/business/energy-environment/data-center-energy-electricity-costs.html.
[84] PJM, “Critical Issue Fast Path – Large Load Additions Stakeholder Comments,” August 28, 2025, https://www.pjm.com/-/media/DotCom/committees-groups/cifp-lla/postings/20250828-stakeholder-comments-cifp-lla.pdf.
[85] The White House, “Ratepayer Protection Pledge,” press release, March 4, 2026, www.whitehouse.gov/releases/2026/03/ratepayer-protection-pledge/.
[86] FERC is already moving in this direction: the December 2025 PJM co-location order (193 FERC ¶ 61,217) requires co-located loads to choose between firm and non-firm transmission service classifications, directly allocating curtailment risk to the load rather than socializing it across the rate base. Multiple legal analysts expect FERC to extend this framework nationally through a forthcoming rulemaking, and the paper hearing process established by that order provides a procedural foundation for FERC to expand minimum contract terms and financial assurance requirements to large load customers in other territories. Eric K. Runge et al., “Alert: Federal Energy Regulatory Commission Orders Major PJM Tariff Reforms for Co-Located Load and Behind-The-Meter Generation,” Day Pitney LLP, December 19, 2025, https://www.daypitney.com/alert-federal-energy-regulatory-commission-orders-major-pjm-tariff-reforms-for-co-located-load-and-behind-the-meter-generation.
[87] We adopt ~400 TWh for data centers (mid-range of the 2030 forecasts compiled in World Resources Institute, The Growing Energy Footprint of U.S. Data Centers, 2025) and ~130 TWh for cryptocurrency mining (within the 60–480 TWh range for 2028 cited in Congressional Research Service Report R48914, drawing on EIA and DOE estimates), totaling ~530 TWh.
[88] Beyond the data-center and crypto base, we add a conservative allowance of ~25 TWh of other large industrial load — a gross ~100 TWh of non-data-center large loads less ~75% exempted under the strategic carveouts noted above (e.g., primary aluminum, furnace steel, semiconductor fabrication) — bringing the net taxable base to ~555 TWh.
[89] At $15/MWh on a 555 TWh base, first-year (FY2030) revenue is ~$8.3 billion ($15 × 555 million MWh). Growing the taxable base at 3% annually, cumulative revenue over FY2030–2039 is ~$95 billion.
[90] Martin T. Ross and Jackson Ewing, “Data Centers and Generation Capacity over the Next Decade: Potential Benefits of Flexibility,” Nicholas Institute for Energy, Environment & Sustainability, Duke University, 2026, https://nicholasinstitute.duke.edu/sites/default/files/publications/data-centers-generation-capacity-over-next-decade.pdf.
[91] Tyler Norris et al., “Rethinking Load Growth: Assessing the Potential for Integration of Large Flexible Loads in U.S. Power Systems,” Nicholas Institute for Energy, Environment & Sustainability, Duke University, 2025, https://nicholasinstitute.duke.edu/sites/default/files/publications/rethinking-load-growth.pdf.
[92] Mandatory curtailment and voluntary demand response for large loads over 75 MW in ERCOT: Tex. Util. Code Ann. §§ 39.160–.165 (West 2025), https://statutes.capitol.texas.gov/?tab=1&code=UT&chapter=UT.39&artSec=39.160; Proposing model tariff incentivizing load flexibility through interruptible rate options for large-load customers: Tentative Order, Pennsylvania Public Utility Commission, Docket No. M-2025-3054271 (Nov. 6, 2025), https://www.puc.pa.gov/docket/M-2025-3054271; Rebekah de la Mora, “Large-Load Customer Treatment: Recent State Action on Load Growth, Data Centers, and Generation Capacity,” DSIRE Insight, September 29, 2025, https://www.dsireinsight.com/blog/2025/9/29/large-load-customer-treatment-recent-state-action-on-load-growth-data-centers-and-generation-capacity.
[93] Energy and Water Development and Related Agencies Appropriations Act, 2026, H.R. 4553, 119th Cong. (2025), congress.gov/bill/119th-congress/house-bill/4553.
[94] FERC authority to ensure wholesale rates, terms, and conditions are just and reasonable: Federal Power Act §§ 205–206, 16 U.S.C. §§ 824d–824e (2018), https://www.ferc.gov/sites/default/files/2021-04/federal_power_act.pdf; Upholding FERC authority to regulate demand response in wholesale electricity markets as directly affecting wholesale rates: FERC v. Electric Power Supply Ass’n, 577 U.S. 260 (2016).