After a gap caused by the government shutdown, employment numbers are back, albeit a month delayed. The Bureau of Labor Statistics conducted its September surveys as usual, though the October surveys were not. This will have longer-term repercussions for U.S. economic data, but for now we can focus on what the September data tell us about the state of the labor market and the economy. The data highlight three key economic facts about the current moment: The post-pandemic fiscal response succeeded in spurring a rapid recovery, the stalling labor market is exacerbating inequality, and perhaps most urgently, a recession looks increasingly likely on the horizon.
***
U.S. employment data is a complicated beast, assembled from three main data sources.
Employment and unemployment rates, along with various personal characteristics, come from the household survey, conducted by the BLS each month of a large sample of US households. The overall population, along with distribution across basic demographic categories of age, sex, and race, comes from the US census. Census numbers are updated at the start of each year and use projected population increases for the periods in between. Finally, total employment numbers, and their distribution across industries, come from the establishment survey, conducted across a sample of U.S. employers. Because of the immense range of sizes of US businesses and the unpredictable rates at which new businesses are born and existing ones die, contacting a representative sample of businesses is more difficult for businesses than households — the source of the large revisions employment numbers are often subject to.
These three sets of numbers combine to provide the indicators in each month’s Employment Situation report. But because they come from different sources, they are not always consistent with each other.
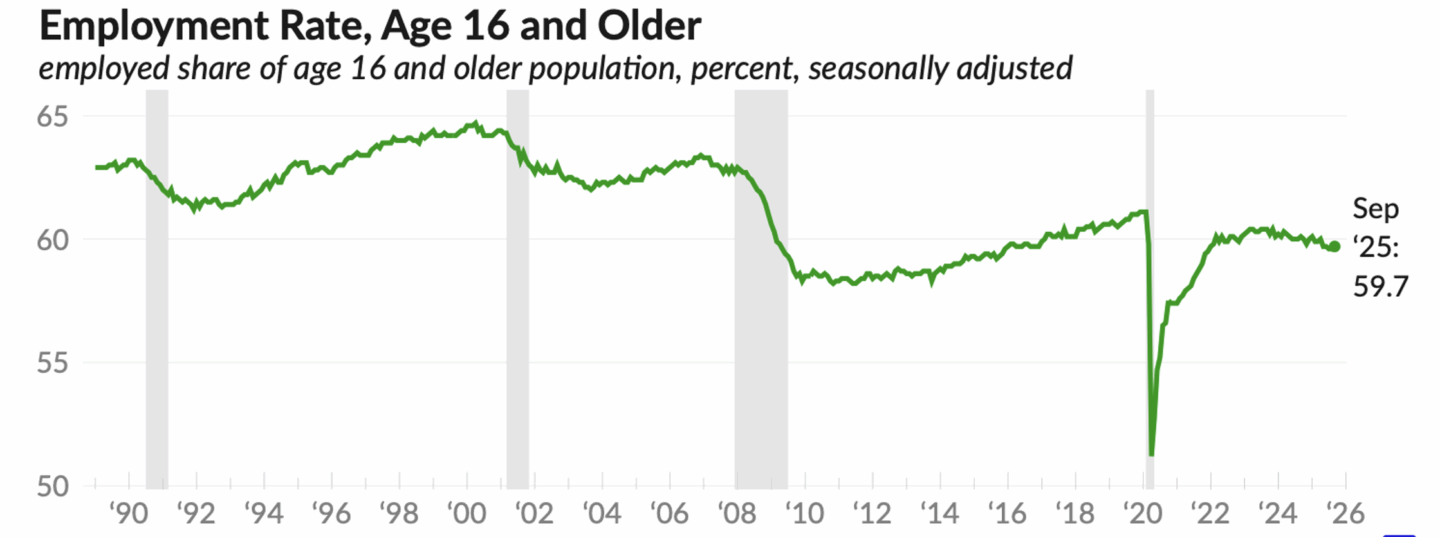
The big puzzle in the September data is the combination of steady growth in total employment and the continued rise in unemployment. Based on the establishment survey, employment rose by 119,000 between August and September; over the past year, employment is up by 1.3 million, or 0.8%. Yet the household survey shows that the unemployment rate increased by 0.1% in the past month; over the past year the unemployment rate is up by 0.3%, while the labor force participation rate is down by a similar amount. Between rising unemployment and falling labor force participation, there has been a fall in the employment-population ratio of 0.4%, from 60.1% a year ago to 59.7% today.
The only way that all these numbers can be correct is if the working-age population grew by 1.5%. Yet the census estimates used by the BLS show an increase in the working age population of just 1% over the past year And since the census makes its population projections at the start of each year; this 1% growth does not reflect the immigration crackdowns this year; so actual growth in the working-age population was probably slower, possibly much slower. One recent paper from the Dallas Federal Reserve Bank estimates that true growth of the working-age population over the past year might be just 0.25%.
It is mathematically impossible for employment to grow by 0.8%, the employment-population ratio to fall by 0.4%, and the working-age population to grow by just 1% (let along 0.25%). All of these numbers cannot be correct. Either actual population growth was faster than we think; or employment growth was slower; or the employment rate is lower (and the unemployment rate higher) than the official numbers say.
In my view, the household survey is the most reliable piece of the puzzle; I would be very surprised if the unemployment or laborforce participation rates get significantly revised. The most likely possibility, in my opinion, is that subsequent revisions will show that employment growth was significantly slower than what the current numbers suggest. It’s not impossible that, despite everything, immigration-driven labor force growth has remained strong. But it is more probable that job growth will be revised down.
***
Turning to the substance of the report, there are three big stories we should keep in mind as we look at the September numbers.
The first big story is that the economic response to the pandemic really worked. Indeed, there is a good case that it was the most successful example of countercyclical policy in US history.
In early 2020, the US experienced the sharpest fall in employment and economic activity in our history. There was good reason to fear that the immediate supply-side disruptions of the pandemic would lead to a collapse in demand, as businesses without sales shut down and laid-off workers stopped spending. But instead, just three years later, the employment rate for people of prime working age (25-54) was higher than it was just before the pandemic and not far short of its all-time high in early 2000.
As the figure nearby shows, this rapid recovery is in marked contrast to other recent recessions, where prime-age employment rates remained below their pre-recession peak for many years into the recovery — as long as 12 years, in the case of 2007.
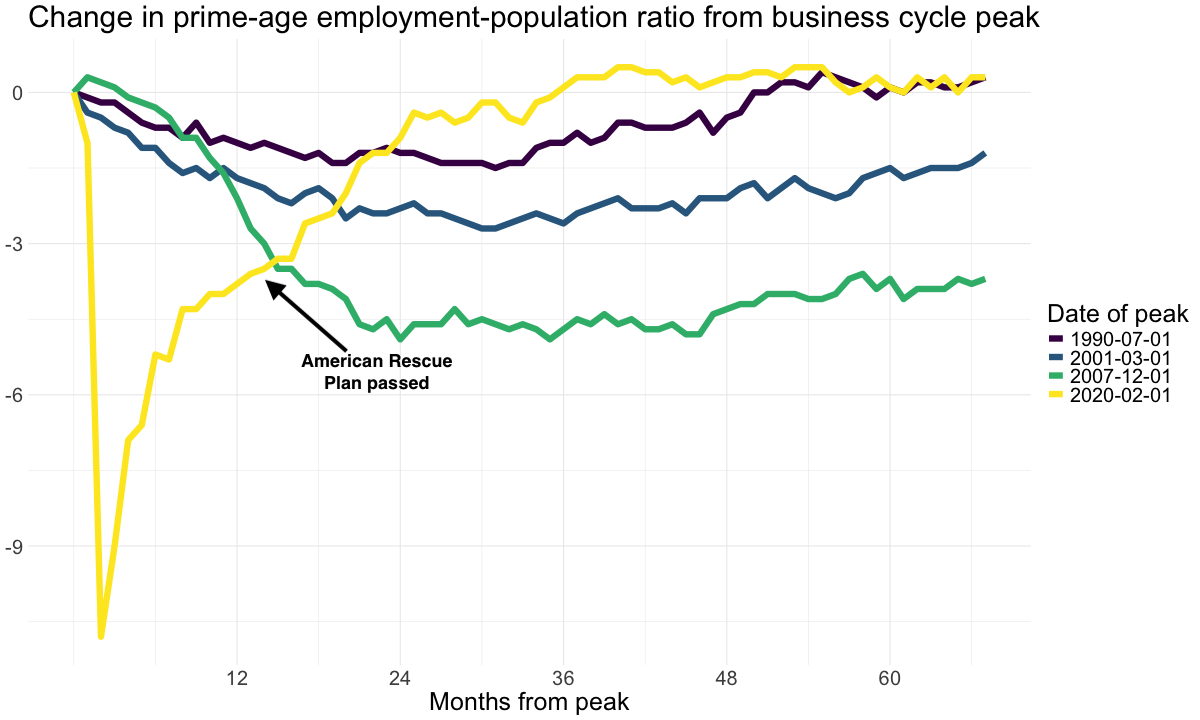
Source: BLS, Groundwork Collaborative analysis
Some people might say that this reflects the difference in the nature of the shock — that the pandemic was inherently a more short-lived interruption to economic activity than the financial disruptions that triggered earlier recessions. But this misses the way that falls in demand can perpetuate themselves, even once the initial source is removed. Businesses that close down in a crisis do not immediately re-open once the crisis is resolved. When people lose jobs, their reduced income and spending will lead to lower demand elsewhere in the economy; this will depress output and employment regardless of the reasons for the initial job loss.
These effects of demand are now well-known to economists under the label hysteresis — today, it is widely agreed that even temporary demand shortfalls can lead to persistent falls in economic activity that greatly outlast the initial shock.
There were good reasons to think, in 2020, that this was the path the economy was headed down. Businesses that closed during the pandemic would struggle to reopen; people who lost their jobs, even temporarily, would have to cut back on spending, reducing demand even in sectors of the economy not affected by the pandemic itself. And this would be compounded by a wave of foreclosures and debt defaults; even if the recession didn’t start with a financial crisis, it might have developed into one.
The reason this did not happen was because of the scale of the response from the federal government. For the first time in US history, the government fully replaced the income lost in an economic crisis. So there were no knock-on effects to demand and no permanent scarring to the labor market. That — and not the nature of the shock — is the most important reason why the recovery from the pandemic looked so different from earlier business-cycle recoveries.
This enormous policy success has been crowded out in people’s memory by the subsequent inflation. So it’s worth stressing that this is why the Biden administration was right to make a big stimulus measure its first priority on coming into office.
As you can see in the figure, while there was a strong recovery in the second half of 2020, employment growth was much slower in early 2021. It is easy to imagine, in retrospect, that employment rates might have plateaued somewhere well short of their pre-pandemic levels. Indeed, this is what forecasters at places like the Congressional Budget Office were predicting at the time. In February of 2021, they projected that it would take more than twice as long for total employment to reach pre-pandemic levels as it did in reality. And they were projecting an overall employment population ratio for mid-2025 of 57.5% — more than two full points below September’s actual ratio. The fact that rapid employment growth resumed a few months after the passage of the American Rescue Plan isn’t proof of a connection. But it is certainly suggestive.
Apart from a few months in 2024, today’s prime-age employment rate of 80.7% has been exceeded in only one earlier period, from late 1997 to early 2001. So while there are certainly reasons for concern in the most recent job report — which I will get into in the next two items — the most important thing we should remember is that this historically high employment rate was not inevitable or solely the result of anonymous economic forces. It is the fruit of good policy choices made a few years ago.
***
The second big story reinforced by recent jobs numbers is that labor market conditions matter for inequality. We can see this today in the much larger rise in unemployment among Black workers.
If one pillar of textbook macroeconomics that has had to be revised in recent years is the idea that demand conditions have no lasting effects on the economy, a second is that labor market conditions only matter for the overall pace of wage growth. The distribution of wages across individuals, in this older view, depends on their “human capital” and other individual characteristics.
But what’s become very clear is that the state of the labor market matters more for some workers than for others. For people whose employment is protected by long-term contracts and credentials, or who are the sort of people that employers prefer — college-educated white men in their prime working years — employment outcomes may be relatively insensitive to the state of the labor market. But for workers in more contingent, precarious employment arrangements, or from groups less favored by employers — Black workers, young people looking for their first jobs, those without college degrees — their prospects depend much more on the balance of power in the labor market. When you are last hired, first fired, your situation depends very strongly on how much hiring and firing is currently going on.
Arguably this has always been true. But it’s become more widely recognized among economists and policymakers in recent years. Not long before the pandemic, for example, Fed Chair Jerome Powell acknowledged the role of weak demand — due in part to poor monetary-policy choices — in exacerbating inequality. This is something previous chairs had disavowed responsibility for.
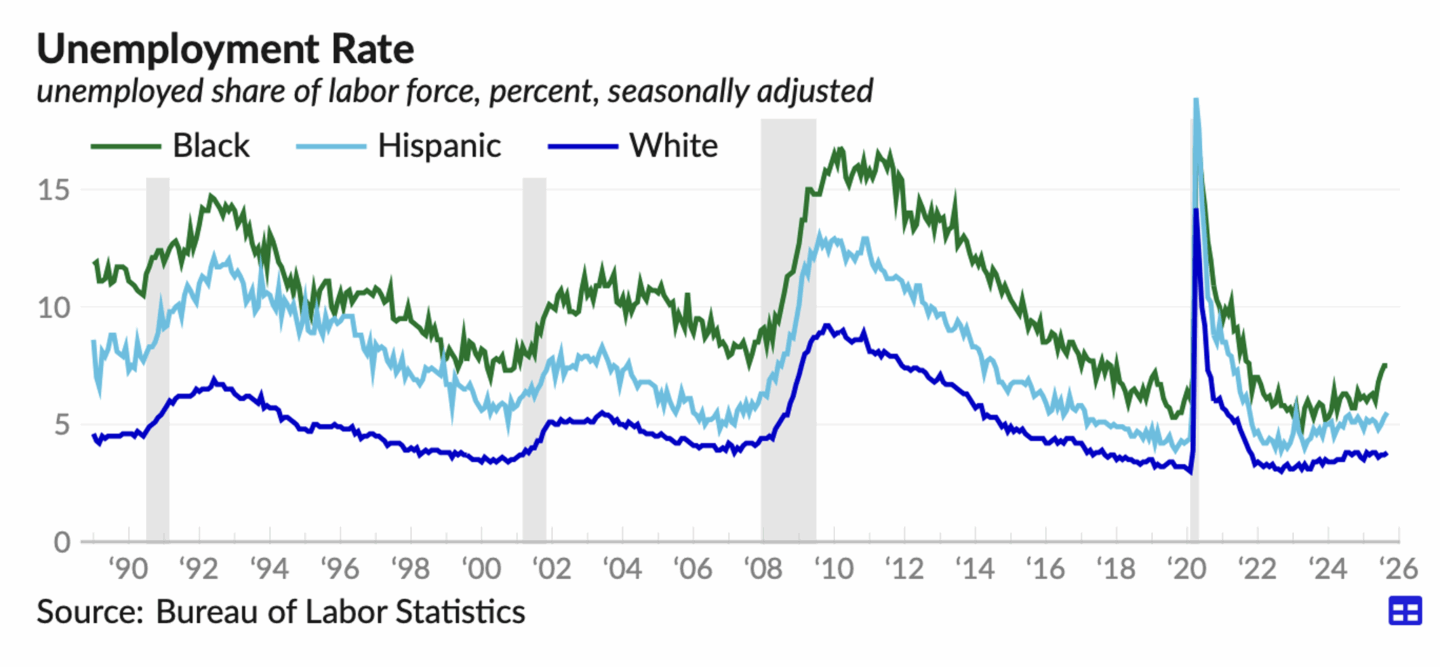
During the immediate recovery from the pandemic, these distributional effects were positive, as a strong labor market disproportionately benefited those most likely to be left out. In 2021 and 2022, wages at the bottom of the distribution rose substantially faster than those higher up. Similarly, in the strong labor market of the late 2010s, the Black-white gap in unemployment rates fell to historically low levels. In the even stronger labor market of the post-pandemic recovery, it fell even more — in 2023, the gap between the Black unemployment rate and the overall rate briefly fell below 1.5%, the smallest gap on record. (See the figure nearby.)
But over the past year, as the labor market has softened, wage growth at the bottom has begun to lag the growth in wages higher up. And the unemployment rate among Black Americans has risen much faster than among other groups. Over the year ending in September, according to the most recent BLS numbers, the unemployment rate for Black workers is up 1.8 points, compared with a rise of just 0.1 points for white workers.
When Black unemployment started rising sharply compared with the overall rate over the summer, there was the possibility it was a statistical blip. But September’s report confirms that this is a real trend. This is deeply concerning in itself. But it’s also a reminder that keeping up demand and tight labor markets are not just important from a macroeconomic perspective; they are also powerful tools for social justice along other dimensions. And conversely, of course, weak labor markets exacerbate other forms of inequality — as we are seeing now.
***
The third big story in recent jobs reports is that a recession looks increasingly likely.
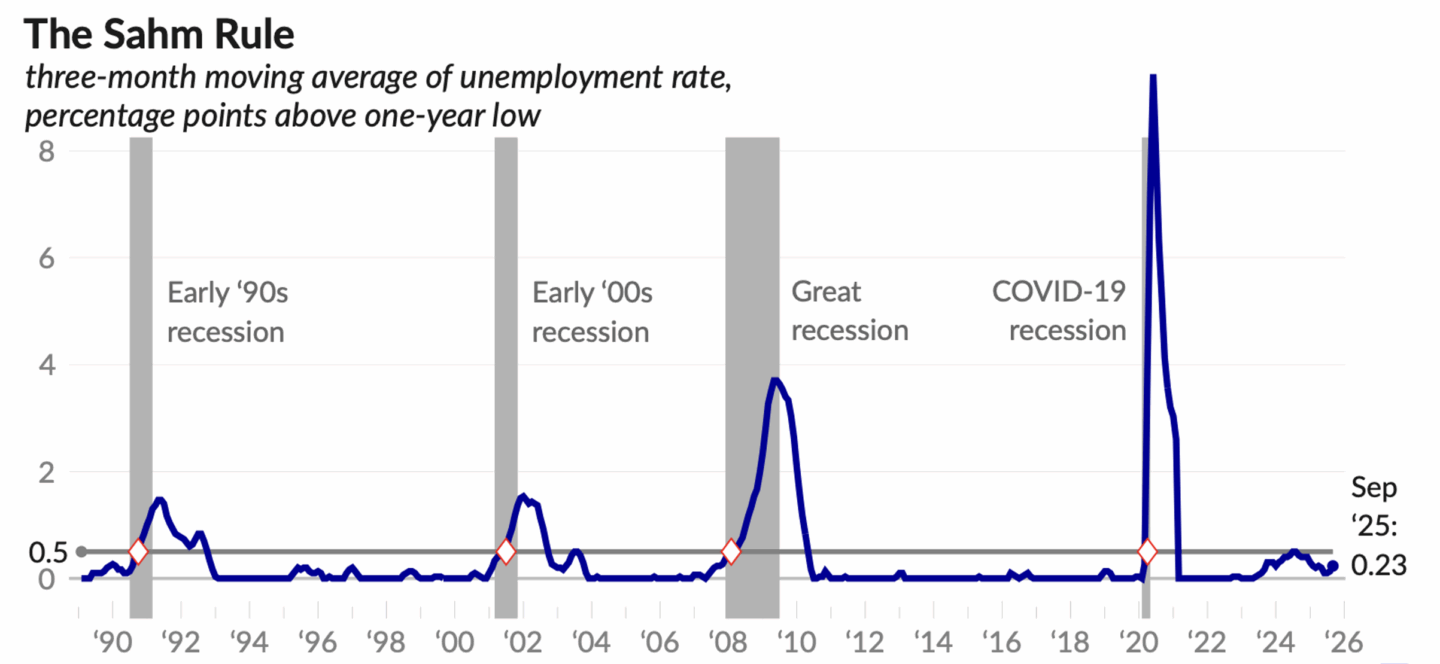
In recent years, discussions of recession have often focused on the Sahm Rule, a rule of thumb based on a comparison of the past three months’ average unemployment rate with the lowest three-month average from the previous twelve months. The rule that Claudia Sahm proposed — originally as a trigger for enhanced unemployment benefits, rather than as a forecasting tool per se — was a threshold of 0.5, i.e. an average unemployment rate over the past three months at least half a point higher than the lowest rate in the past year. In recent decades, this has inevitably signaled a recession.
As the figure nearby shows, this threshold was briefly reached in mid-2024, without any official recession. The indicator has since receded back toward zero — not because the unemployment rate has come down, but because the big rise in unemployment came in 2023, and has now moved beyond the rule’s window. Since then, measured unemployment has been fairly stable.
It is worth thinking about why a rule like this might work in the first place. The critical fact about the world highlighted by the Sahm rule is that moderate increases in unemployment are, historically, almost always followed by much larger increases. This is not something that just happens to be true. It reflects a basic fact about how the economy works: Income creates spending, and spending creates incomes. This positive feedback loop is what powers growth — when businesses undertake new investment projects, that spending circulates through the economy, creating additional income and spending that, in the aggregate, justifies the investment spending.
But this process can also work in reverse. A fall in spending leads to a fall in incomes, which leads to a further fall in spending. The difference between these two feedbacks is the reason our economy experiences distinct periods of expansion and recession, rather than a smooth range of different growth rates.
There are metaphors that are widely used in talking about business cycles that capture the idea of tipping points or phase transitions. An airplane has a stall speed: if it slows down a bit, it flies a bit slower, but if it slows down too much then it stops flying entirely and falls to the ground. A car trying to go up an icy hill needs to build up a enough speed to make it to the top; if it goes faster than this, it will arrive at the top going faster, but if it goes slower, it will slip back down and won’t make it to the top at all.
The idea that a certain level of growth in demand is required to prevent a sharp fall in demand is a familiar one in practical economic discussions, even if it’s not always stated clearly. It’s implicit in the idea of business cycles and recessions as distinct phenomena in their own right, as opposed to just labels of convenience for unusually large random shocks. There are many reasons why this sort of “stall speed” might exist, but two of the most important are the “accelerator” mechanism linking investment and demand, and the limited financial buffers possessed by most households.
We needn’t go into the details of these stories in this post; the key point for present purposes is that there are good reasons why a small fall in employment or expenditure is likely to reverse itself, but a large enough fall will snowball into an even bigger one. This is why the Sahm rule is not just a historical accident, but captures an important business-cycle regularity.
The unemployment rate is our most timely indicator of the overall level of economic activity. A large rise in unemployment is not just a negative outcome in itself; it indicates a fall in spending and activity that will have further effects. Over the past two years unemployment has risen by almost a full point — too slowly to trigger the Sahm rule, but a large enough rise that, based on historical experience, we would expect to be near the recession tipping point. At the least, it suggests a situation in which any new negative shock — an abrupt slowdown in data-center investment, for instance — could send the economy out of what the great Keynesian economist Axel Liejonhufvud described as the “corridor of stability,” and into a recessionary spiral.
***
One final point: There is no reason to think that this data is distorted or politically biased.
Attacks on professional norms are a hallmark of the Trump approach to governance. But while the administration can certainly interfere with timely collection and publication of data, and while, even in the best of times, there are serious challenges to constructing meaningful summaries of all the myriad forms of economic activity, there is no reason to think there is political interference in the employment data. More than that: I would say there is strong reason to believe that there isn’t. Given the deep commitment to the civil servants at the BLS and other national statistical agencies, if there were any pressure on them to change the numbers, we would certainly hear about it.